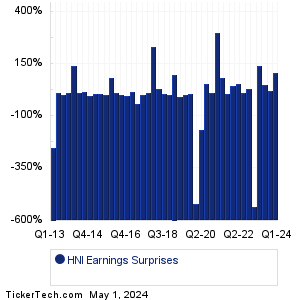
| HNI Earnings Surprises | ||||||||||||||||||||||||||||||||||||||||||||||||||||||||||||||||||||||||||||||||||||||||||||||||||||||||||||||||||||||||||||||||||||||||||||||||||||||||||||||||||||||||||||
|
|
|
| HNI Earnings Surprises | ||||||||||||||||||||||||||||||||||||||||||||||||||||||||||||||||||||||||||||||||||||||||||||||||||||||||||||||||||||||||||||||||||||||||||||||||||||||||||||||||||||||||||||
|
|
|
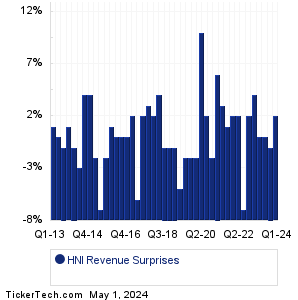
| HNI Revenue Surprises | ||||||||||||||||||||||||||||||||||||||||||||||||||||||||||||||||||||||||||||||||||||||||||||||||||||||||||||||||||||||||||||||||||||||||||||||||||||||||||||||||||||||||||||
|
| HNI Current Stock Quote |
Get Dividend Alerts Get SEC Filing Alerts |
| HNI Stock Price Chart |
| Next Earnings Dates |
Next Earnings Date Calendar:Delta Air Lines (DAL): 4/10/2024 6:30 AMPure Cycle (PCYO): 4/10/2024 After close Rent the Runway (RENT): 4/10/2024 After close Lakeland Industries (LAKE): 4/10/2024 After close Richardson Electronics (RELL): 4/10/2024 After close Fastenal (FAST): 4/11/2024 6:00 AM Hooker Furnishings (HOFT): 4/11/2024 6:00 AM Conn's (CONN): 4/11/2024 6:00 AM HF Sinclair (DINO): 4/11/2024 6:30 AM CarMax (KMX): 4/11/2024 6:50 AM More from the Next Earnings Dates Calendar Earnings History:Intensity Therapeutics (INTS): 4/9/2024 After closeAehr Test Systems (AEHR): 4/9/2024 After close SMART Glb Hldgs (SGH): 4/9/2024 After close WD-40 (WDFC): 4/9/2024 After close Pricesmart (PSMT): 4/9/2024 After close Greenidge Generation Hldg (GREE): 4/9/2024 After close Art's-Way Manufacturing (ARTW): 4/9/2024 11:00 AM Kartoon Studios (TOON): 4/9/2024 8:00 AM Neogen (NEOG): 4/9/2024 7:00 AM Cue Biopharma (CUE): 4/8/2024 After close More from the Earnings History archive |
| Earnings Peers |
| HNI (HNI) is categorized under the Industrials sector; to help you further research past earnings across stocks, below are some other companies in the same sector:
HQI Historical Earnings HQY Historical Earnings HRI Historical Earnings HRT Historical Earnings HSC Historical Earnings HSII Historical Earnings HSON Historical Earnings HTLD Historical Earnings HTZ Historical Earnings HUBB Historical Earnings |
Click the button below for your complimentary copy of Your Early Retirement Portfolio: Dividends Up to 8.7%—Every Month—Forever.
You'll discover the details on 4 stocks and funds that pay you massive dividends as high as 8.7%.