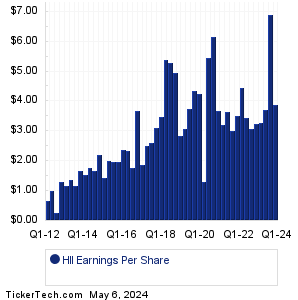
| HII Earnings History | |||||||||||||||||||||||||||||||||||||||||||||||||||||||||||||||||||||||||||||||||||||||||||||||||||||||||||||||||||||||||||||||||||||||||||||||||||
|
|
|
| HII Earnings History | |||||||||||||||||||||||||||||||||||||||||||||||||||||||||||||||||||||||||||||||||||||||||||||||||||||||||||||||||||||||||||||||||||||||||||||||||||
|
|
|
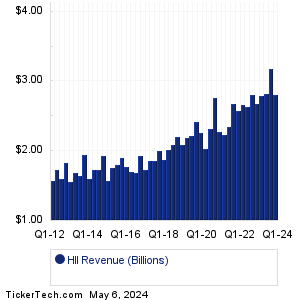
| HII Revenue History | |||||||||||||||||||||||||||||||||||||||||||||||||||||||||||||||||||||||||||||||||||||||||||||||||||||||||||||||||||||||||||||||||||||||||||||||||||
|
| HII Current Stock Quote |
Get Dividend Alerts Get SEC Filing Alerts |
| HII Stock Price Chart |
| Next Earnings Dates |
Next Earnings Date Calendar:Greenbrier Companies (GBX): 4/5/2024 6:05 AMByrna Technologies (BYRN): 4/5/2024 8:00 AM Seelos Therapeutics (SEEL): 4/5/2024 After close CapStar Finl Hldgs (CSTR): 4/5/2024 5:00 PM Neogen (NEOG): 4/9/2024 7:00 AM Greenidge Generation Hldg (GREE): 4/9/2024 After close Pricesmart (PSMT): 4/9/2024 After close WD-40 (WDFC): 4/9/2024 After close SMART Glb Hldgs (SGH): 4/9/2024 After close Aehr Test Systems (AEHR): 4/9/2024 After close More from the Next Earnings Dates Calendar Earnings History:Movano (MOVE): 4/4/2024 After closeKura Sushi USA (KRUS): 4/4/2024 After close Conifer Holdings (CNFR): 4/4/2024 After close Lamb Weston Hldgs (LW): 4/4/2024 8:30 AM Schnitzer Steel (RDUS): 4/4/2024 8:01 AM VAALCO Energy (EGY): 4/4/2024 8:00 AM Conagra Brands (CAG): 4/4/2024 7:30 AM AngioDynamics (ANGO): 4/4/2024 7:00 AM Simply Good Foods (SMPL): 4/4/2024 7:00 AM Lindsay (LNN): 4/4/2024 6:45 AM More from the Earnings History archive |
| Featured Articles |
| Earnings Peers |
| Huntington Ingalls Indus (HII) is categorized under the Industrials sector; to help you further research past earnings across stocks, below are some other companies in the same sector:
HIL Past Earnings HLIO Past Earnings HLMN Past Earnings HNI Past Earnings HQI Past Earnings HQY Past Earnings HRI Past Earnings HRT Past Earnings HSC Past Earnings HSII Past Earnings |
Recommended: Institutional Holders of ECCZ, Funds Holding SPXN, ELLI Options Chain.
Click the button below for your complimentary copy of Your Early Retirement Portfolio: Dividends Up to 9.5%—Every Month—Forever.
You'll discover the details on 4 stocks and funds that pay you massive dividends as high as 9.5%.