| Heska Earnings Surprises | ||||||||||||||||||||||||||||||||||||||||||||||||||||||||||||||||||||||||||||||||||||||||||||||||||||||||||||||||||||||||||||||||||||||||||||

|
|
|
| Heska Earnings Surprises | ||||||||||||||||||||||||||||||||||||||||||||||||||||||||||||||||||||||||||||||||||||||||||||||||||||||||||||||||||||||||||||||||||||||||||||
|
|
|
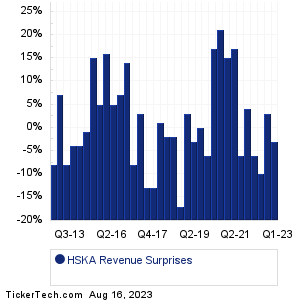
| HSKA Revenue Surprises | ||||||||||||||||||||||||||||||||||||||||||||||||||||||||||||||||||||||||||||||||||||||||||||||||||||||||||||||||||||||||||||||||||||||||||||
|
| HSKA Current Stock Quote |
Get Dividend Alerts Get SEC Filing Alerts |
| HSKA Stock Price Chart |
| Next Earnings Dates |
Next Earnings Date Calendar:Target (TGT): 8/16/2023 6:30 AMBrinker International (EAT): 8/16/2023 6:45 AM Crown Crafts (CRWS): 8/16/2023 6:45 AM Performance Food Gr (PFGC): 8/16/2023 7:00 AM BurgerFi International (BFI): 8/16/2023 7:00 AM TJX Companies (TJX): 8/16/2023 7:30 AM Twin Disc (TWIN): 8/16/2023 8:00 AM Cisco Systems (CSCO): 8/16/2023 After close Synopsys (SNPS): 8/16/2023 After close Wolfspeed (WOLF): 8/16/2023 After close More from the Next Earnings Dates Calendar Earnings History:PAVmed (PAVM): 8/15/2023 5:00 PMJack Henry & Associates (JKHY): 8/15/2023 After close Stride (LRN): 8/15/2023 After close AgEagle Aerial Sys (UAVS): 8/15/2023 After close WidePoint (WYY): 8/15/2023 After close H&R Block (HRB): 8/15/2023 After close Agilent Technologies (A): 8/15/2023 After close Mercury Sys (MRCY): 8/15/2023 After close Key Tronic (KTCC): 8/15/2023 After close Coherent (COHR): 8/15/2023 After close More from the Earnings History archive |
| Earnings Peers |
| Heska (HSKA) is categorized under the Healthcare sector; to help you further research past earnings across stocks, below are some other companies in the same sector:
HSTO Historical Earnings HTBX Historical Earnings HTGM Historical Earnings HUMA Historical Earnings HZNP Historical Earnings IART Historical Earnings IBRX Historical Earnings ICAD Historical Earnings ICCC Historical Earnings ICPT Historical Earnings |
Click the button below for your complimentary copy of Your Early Retirement Portfolio: Dividends Up to 7.8%—Every Month—Forever.
You'll discover the details on 4 stocks and funds that pay you massive dividends as high as 7.8%.