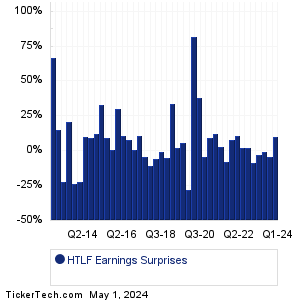
| Heartland Financial USA Earnings Surprises | ||||||||||||||||||||||||||||||||||||||||||||||||||||||||||||||||||||||||||||||||||||||||||||||||||||||||||||||||||||||||||||||||||||||||||||||||||||||||||||
|
|
|
| Heartland Financial USA Earnings Surprises | ||||||||||||||||||||||||||||||||||||||||||||||||||||||||||||||||||||||||||||||||||||||||||||||||||||||||||||||||||||||||||||||||||||||||||||||||||||||||||||
|
|
|
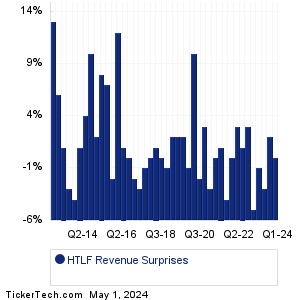
| HTLF Revenue Surprises | ||||||||||||||||||||||||||||||||||||||||||||||||||||||||||||||||||||||||||||||||||||||||||||||||||||||||||||||||||||||||||||||||||||||||||||||||||||||||||||
|
| HTLF Current Stock Quote |
Get Dividend Alerts Get SEC Filing Alerts |
| HTLF Stock Price Chart |
| Next Earnings Dates |
Next Earnings Date Calendar:Allegion (ALLE): 4/26/2023 5:30 AMCentral Pacific Financial (CPF): 4/26/2023 5:30 AM Vertiv Hldgs (VRT): 4/26/2023 5:55 AM Thermo Fisher Scientific (TMO): 4/26/2023 6:00 AM TE Connectivity (TEL): 4/26/2023 6:00 AM Hilton Worldwide Holdings (HLT): 4/26/2023 6:00 AM Owens-Corning (OC): 4/26/2023 6:00 AM Integra Lifesciences (IART): 4/26/2023 6:00 AM Provident Finl Hldgs (PROV): 4/26/2023 6:00 AM Otis Worldwide (OTIS): 4/26/2023 6:10 AM More from the Next Earnings Dates Calendar Earnings History:Gold Resource (GORO): 4/25/2023 5:37 PMFlushing Financial (FFIC): 4/25/2023 5:30 PM Timberland Bancorp (TSBK): 4/25/2023 5:26 PM Community Finl (TCFC): 4/25/2023 5:25 PM Encore Wire (WIRE): 4/25/2023 5:05 PM First Busey (BUSE): 4/25/2023 5:00 PM Carrier Global (CARR): 4/25/2023 After close Veritex Holdings (VBTX): 4/25/2023 After close CFSB Bancorp (CFSB): 4/25/2023 After close Enterprise Bancorp (EBTC): 4/25/2023 After close More from the Earnings History archive |
| Earnings Peers |
| Heartland Financial USA (HTLF) is categorized under the Financials sector; to help you further research past earnings across stocks, below are some other companies in the same sector:
HUM Historical Earnings HVBC Historical Earnings HWBK Historical Earnings HWC Historical Earnings IBCP Historical Earnings IBKR Historical Earnings IBOC Historical Earnings IBTX Historical Earnings ICBK Historical Earnings ICE Historical Earnings |
Recommended: SSNC Videos, FLCO Videos, RXDX Historical Stock Prices.