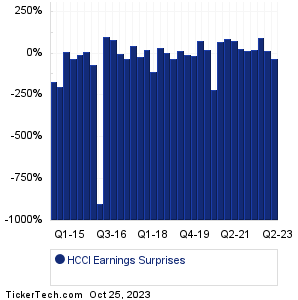
| HCCI Earnings Surprises | ||||||||||||||||||||||||||||||||||||||||||||||||||||||||||||||||||||||||||||||||||||||||||||||||||||||||||||||||||||||||||||||||||||||||||||
|
|
|
| HCCI Earnings Surprises | ||||||||||||||||||||||||||||||||||||||||||||||||||||||||||||||||||||||||||||||||||||||||||||||||||||||||||||||||||||||||||||||||||||||||||||
|
|
|
| HCCI Revenue Surprises | ||||||||||||||||||||||||||||||||||||||||||||||||||||||||||||||||||||||||||||||||||||||||||||||||||||||||||||||||||||||||||||||||||||||||||||

|
| HCCI Current Stock Quote |
Get Dividend Alerts Get SEC Filing Alerts |
| HCCI Stock Price Chart |
| Next Earnings Dates |
Next Earnings Date Calendar:Lithia Motors (LAD): 10/25/2023 5:00 AMVertiv Hldgs (VRT): 10/25/2023 5:55 AM Thermo Fisher Scientific (TMO): 10/25/2023 6:00 AM Hilton Worldwide Holdings (HLT): 10/25/2023 6:00 AM Owens-Corning (OC): 10/25/2023 6:00 AM Integra Lifesciences (IART): 10/25/2023 6:00 AM Greenbrier Companies (GBX): 10/25/2023 6:00 AM Provident Finl Hldgs (PROV): 10/25/2023 6:00 AM Otis Worldwide (OTIS): 10/25/2023 6:07 AM Taylor Morrison Home (TMHC): 10/25/2023 6:15 AM More from the Next Earnings Dates Calendar Earnings History:Encore Wire (WIRE): 10/24/2023 5:05 PMWeatherford International (WFRD): 10/24/2023 5:01 PM First Busey (BUSE): 10/24/2023 5:00 PM First Commonwealth (FCF): 10/24/2023 5:00 PM Waste Management (WM): 10/24/2023 5:00 PM Rush Enterprises (RUSHB): 10/24/2023 After close Rush Enterprises (RUSHA): 10/24/2023 After close Brandywine Realty Tr (BDN): 10/24/2023 After close MSA Safety (MSA): 10/24/2023 After close Range Resources (RRC): 10/24/2023 After close More from the Earnings History archive |
| Earnings Peers |
| Heritage-Crystal Clean (HCCI) is categorized under the Industrials sector; to help you further research past earnings across stocks, below are some other companies in the same sector:
HCHC Historical Earnings HCKT Historical Earnings HCSG Historical Earnings HDSN Historical Earnings HEES Historical Earnings HEI Historical Earnings HGBL Historical Earnings HI Historical Earnings HII Historical Earnings HIL Historical Earnings |
Recommended: Top Ten Hedge Funds Holding MTUL, CHBH Insider Buying, FSAM Videos.
Click the button below for your complimentary copy of Your Early Retirement Portfolio: Dividends Up to 8.1%—Every Month—Forever.
You'll discover the details on 4 stocks and funds that pay you massive dividends as high as 8.1%.