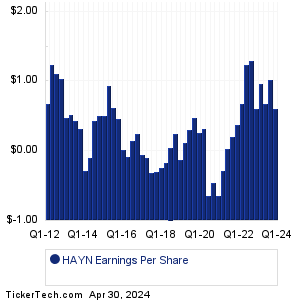
| HAYN Earnings History | ||||||||||||||||||||||||||||||||||||||||||||||||||||||||||||||||||||||||||||||||||||||||||||||||||||||||||||||||||||||||||||||||||||||||||||||||||||||
|
|
|
| HAYN Earnings History | ||||||||||||||||||||||||||||||||||||||||||||||||||||||||||||||||||||||||||||||||||||||||||||||||||||||||||||||||||||||||||||||||||||||||||||||||||||||
|
|
|
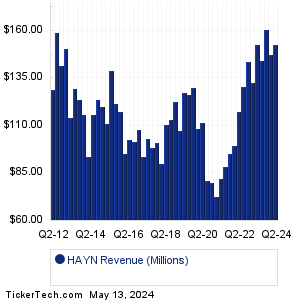
| HAYN Revenue History | ||||||||||||||||||||||||||||||||||||||||||||||||||||||||||||||||||||||||||||||||||||||||||||||||||||||||||||||||||||||||||||||||||||||||||||||||||||||
|
| HAYN Current Stock Quote |
Get Dividend Alerts Get SEC Filing Alerts |
| HAYN Stock Price Chart |
| Next Earnings Dates |
Next Earnings Date Calendar:Truist Finl (TFC): 4/22/2024 5:45 AMAZZ (AZZ): 4/22/2024 6:30 AM HBT Finl (HBT): 4/22/2024 6:45 AM Bank of Hawaii (BOH): 4/22/2024 6:45 AM Verizon Communications (VZ): 4/22/2024 7:00 AM Zions Bancorp (ZION): 4/22/2024 8:00 AM Washington Trust Bancorp (WASH): 4/22/2024 8:00 AM MainStreet Bancshares (MNSB): 4/22/2024 8:00 AM Dynex Cap (DX): 4/22/2024 8:00 AM Albertsons Companies (ACI): 4/22/2024 8:30 AM More from the Next Earnings Dates Calendar Earnings History:Retractable Technologies (RVP): 4/19/2024 5:00 PMPark Ntl (PRK): 4/19/2024 After close BCB Bancorp (BCBP): 4/19/2024 After close C&F Financial (CFFI): 4/19/2024 After close Parke Bancorp (PKBK): 4/19/2024 After close Taitron Components (TAIT): 4/19/2024 After close Acme United (ACU): 4/19/2024 9:00 AM MetroCity Bankshares (MCBS): 4/19/2024 9:00 AM Tootsie Roll Industries (TR): 4/19/2024 9:00 AM Lakeland Bancorp (LBAI): 4/19/2024 8:00 AM More from the Earnings History archive |
| Featured Articles |
| Earnings Peers |
| Haynes Intl (HAYN) is categorized under the Materials sector; to help you further research past earnings across stocks, below are some other companies in the same sector:
HAYW Past Earnings HBP Past Earnings HCC Past Earnings HL Past Earnings HNRG Past Earnings HUN Past Earnings HWKN Past Earnings HWM Past Earnings HXL Past Earnings HYMC Past Earnings |
Recommended: HUMA shares outstanding history, Funds Holding SYNL, Funds Holding ATS.
Click the button below for your complimentary copy of Your Early Retirement Portfolio: Dividends Up to 8.7%—Every Month—Forever.
You'll discover the details on 4 stocks and funds that pay you massive dividends as high as 8.7%.