| Greenhill & Co Earnings History | ||||||||||||||||||||||||||||||||||||||||||||||||||||||||||||||||||||||||||||||||||||||||||||||||||||||||||||||||||||||||||||||||||||||||||||||||

|
|
|
| Greenhill & Co Earnings History | ||||||||||||||||||||||||||||||||||||||||||||||||||||||||||||||||||||||||||||||||||||||||||||||||||||||||||||||||||||||||||||||||||||||||||||||||
|
|
|
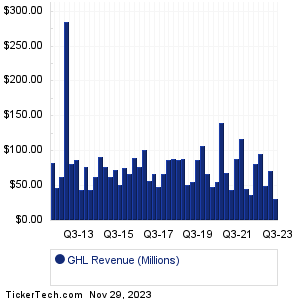
| GHL Revenue History | ||||||||||||||||||||||||||||||||||||||||||||||||||||||||||||||||||||||||||||||||||||||||||||||||||||||||||||||||||||||||||||||||||||||||||||||||
|
| GHL Current Stock Quote |
Get Dividend Alerts Get SEC Filing Alerts |
| GHL Stock Price Chart |
| Next Earnings Dates |
Next Earnings Date Calendar:Donaldson (DCI): 11/29/2023 6:00 AMDollar Tree (DLTR): 11/29/2023 6:30 AM Hormel Foods (HRL): 11/29/2023 6:30 AM Foot Locker (FL): 11/29/2023 6:45 AM Patterson Cos (PDCO): 11/29/2023 7:00 AM Petco Health and Wellness (WOOF): 11/29/2023 7:00 AM Construction Partners (ROAD): 11/29/2023 7:30 AM Vestis (VSTS): 11/29/2023 8:00 AM Okta (OKTA): 11/29/2023 After close Five Below (FIVE): 11/29/2023 After close More from the Next Earnings Dates Calendar Earnings History:Jewett-Cameron Trading (JCTCF): 11/28/2023 5:30 PMFluence Energy (FLNC): 11/28/2023 5:19 PM Servotronics (SVT): 11/28/2023 5:00 PM Evelo Biosciences (EVLO): 11/28/2023 5:00 PM Leslies (LESL): 11/28/2023 After close AZEK Co (AZEK): 11/28/2023 After close Hewlett Packard (HPE): 11/28/2023 After close Splunk (SPLK): 11/28/2023 After close CrowdStrike Holdings (CRWD): 11/28/2023 After close NetApp (NTAP): 11/28/2023 After close More from the Earnings History archive |
| Featured Articles |
| Earnings Peers |
| Greenhill & Co (GHL) is categorized under the Financials sector; to help you further research past earnings across stocks, below are some other companies in the same sector:
GHLD Past Earnings GIPR Past Earnings GL Past Earnings GLPI Past Earnings GLRE Past Earnings GMRE Past Earnings GNL Past Earnings GNTY Past Earnings GNW Past Earnings GOCO Past Earnings |
Recommended: UJB YTD Return, Top Ten Hedge Funds Holding SP, BUFF Historical Stock Prices.
Click the button below for your complimentary copy of Your Early Retirement Portfolio: Dividends Up to 9.5%—Every Month—Forever.
You'll discover the details on 4 stocks and funds that pay you massive dividends as high as 9.5%.