| Goldman Sachs Gr Earnings Surprises | ||||||||||||||||||||||||||||||||||||||||||||||||||||||||||||||||||||||||||||||||||||||||||||||||||||||||||||||||||||||||||||||||||||||||||||||||||||||||||||||||||||||||||||||||||||||||
|
|
|
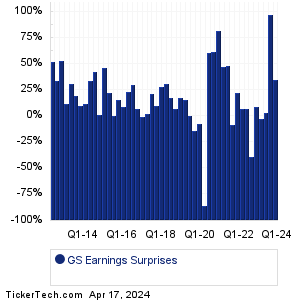
| Goldman Sachs Gr Earnings Surprises | ||||||||||||||||||||||||||||||||||||||||||||||||||||||||||||||||||||||||||||||||||||||||||||||||||||||||||||||||||||||||||||||||||||||||||||||||||||||||||||||||||||||||||||||||||||||||
|
|
|
| GS Revenue Surprises | ||||||||||||||||||||||||||||||||||||||||||||||||||||||||||||||||||||||||||||||||||||||||||||||||||||||||||||||||||||||||||||||||||||||||||||||||||||||||||||||||||||||||||||||||||||||||

|
| GS Current Stock Quote |
Get Dividend Alerts Get SEC Filing Alerts |
| GS Stock Price Chart |
| Next Earnings Dates |
Next Earnings Date Calendar:Regions Finl (RF): 7/21/2023 6:00 AMComerica (CMA): 7/21/2023 6:45 AM Roper Techs (ROP): 7/21/2023 6:55 AM Sensient Technologies (SXT): 7/21/2023 6:55 AM AutoNation (AN): 7/21/2023 6:59 AM American Express (AXP): 7/21/2023 7:00 AM SLB (SLB): 7/21/2023 7:00 AM Huntington Bancshares (HBAN): 7/21/2023 7:00 AM Interpublic Gr of Cos (IPG): 7/21/2023 7:00 AM World Acceptance (WRLD): 7/21/2023 7:30 AM More from the Next Earnings Dates Calendar Earnings History:HMN Finl (HMNF): 7/20/2023 7:00 PMAmerant Bancorp (AMTB): 7/20/2023 5:00 PM Hilltop Hldgs (HTH): 7/20/2023 After close CapStar Finl Hldgs (CSTR): 7/20/2023 After close Manhattan Bridge Capital (LOAN): 7/20/2023 After close Glacier Bancorp (GBCI): 7/20/2023 After close 1st Source (SRCE): 7/20/2023 After close Chemung Financial (CHMG): 7/20/2023 After close Bar Harbor Bankshares (BHB): 7/20/2023 After close CNB Financial (CCNE): 7/20/2023 After close More from the Earnings History archive |
| Earnings Peers |
| Goldman Sachs Gr (GS) is categorized under the Financials sector; to help you further research past earnings across stocks, below are some other companies in the same sector:
GSBC Historical Earnings GSHD Historical Earnings GTY Historical Earnings GWB Historical Earnings HAFC Historical Earnings HALL Historical Earnings HASI Historical Earnings HBAN Historical Earnings HBCP Historical Earnings HBMD Historical Earnings |
Recommended: EQX Split History, SLTC Insider Buying, Funds Holding SBND.
Click the button below for your complimentary copy of Your Early Retirement Portfolio: Dividends Up to 7.8%—Every Month—Forever.
You'll discover the details on 4 stocks and funds that pay you massive dividends as high as 7.8%.