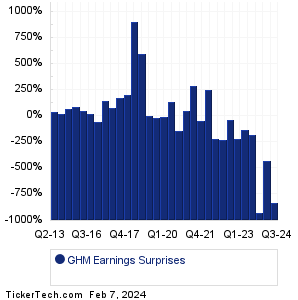
| GHM Earnings Surprises | ||||||||||||||||||||||||||||||||||||||||||||||||||||||||||||||||||||||||||||||||||||||||||||||||||||||||||||||||||||||||||||||||
|
|
|
| GHM Earnings Surprises | ||||||||||||||||||||||||||||||||||||||||||||||||||||||||||||||||||||||||||||||||||||||||||||||||||||||||||||||||||||||||||||||||
|
|
|
| GHM Revenue Surprises | ||||||||||||||||||||||||||||||||||||||||||||||||||||||||||||||||||||||||||||||||||||||||||||||||||||||||||||||||||||||||||||||||

|
| GHM Current Stock Quote |
Get Dividend Alerts Get SEC Filing Alerts |
| GHM Stock Price Chart |
| Next Earnings Dates |
Next Earnings Date Calendar:Hilton Worldwide Holdings (HLT): 2/7/2024 6:00 AMBunge (BG): 2/7/2024 6:00 AM XPO (XPO): 2/7/2024 6:00 AM Kennametal (KMT): 2/7/2024 6:00 AM Edgewell Personal Care (EPC): 2/7/2024 6:00 AM Triumph Group (TGI): 2/7/2024 6:00 AM Carlyle Group (CG): 2/7/2024 6:05 AM CVS Health (CVS): 2/7/2024 6:30 AM OneMain Holdings (OMF): 2/7/2024 6:45 AM Rithm Capital (RITM): 2/7/2024 6:45 AM More from the Next Earnings Dates Calendar Earnings History:ePlus (PLUS): 2/6/2024 5:10 PMAmerican Finl Gr (AFG): 2/6/2024 5:00 PM Jack Henry & Associates (JKHY): 2/6/2024 After close Weatherford International (WFRD): 2/6/2024 After close Atmos Energy (ATO): 2/6/2024 After close IDEX (IEX): 2/6/2024 After close Veralto (VLTO): 2/6/2024 After close Key Tronic (KTCC): 2/6/2024 After close Enact Holdings (ACT): 2/6/2024 After close O-I Glass (OI): 2/6/2024 After close More from the Earnings History archive |
| Earnings Peers |
| Graham (GHM) is categorized under the Industrials sector; to help you further research past earnings across stocks, below are some other companies in the same sector:
GLDD Historical Earnings GLW Historical Earnings GNK Historical Earnings GNRC Historical Earnings GPN Historical Earnings GPX Historical Earnings GRC Historical Earnings GSKY Historical Earnings GTLS Historical Earnings GVA Historical Earnings |
Recommended: Funds Holding PGH, Top Ten Hedge Funds Holding PPEM, CNS Dividend History.
Click the button below for your complimentary copy of Your Early Retirement Portfolio: Dividends Up to 9.5%—Every Month—Forever.
You'll discover the details on 4 stocks and funds that pay you massive dividends as high as 9.5%.