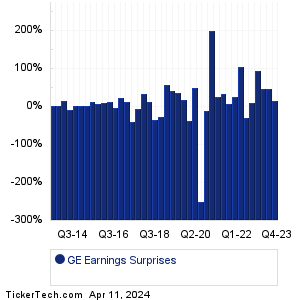
| General Electric Earnings Surprises | ||||||||||||||||||||||||||||||||||||||||||||||||||||||||||||||||||||||||||||||||||||||||||||||||||||||||||||||||||||||||||||||||||||||||||||||||||||||||||||||||||||
|
|
|
| General Electric Earnings Surprises | ||||||||||||||||||||||||||||||||||||||||||||||||||||||||||||||||||||||||||||||||||||||||||||||||||||||||||||||||||||||||||||||||||||||||||||||||||||||||||||||||||||
|
|
|
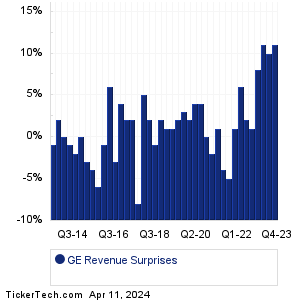
| GE Revenue Surprises | ||||||||||||||||||||||||||||||||||||||||||||||||||||||||||||||||||||||||||||||||||||||||||||||||||||||||||||||||||||||||||||||||||||||||||||||||||||||||||||||||||||
|
| GE Current Stock Quote |
Get Dividend Alerts Get SEC Filing Alerts |
| GE Stock Price Chart |
| Next Earnings Dates |
Next Earnings Date Calendar:Sonida Senior Living (SNDA): 3/27/2024 6:00 AMCellectar Biosciences (CLRB): 3/27/2024 6:40 AM Lands' End (LE): 3/27/2024 6:45 AM Altimmune (ALT): 3/27/2024 7:00 AM GlycoMimetics (GLYC): 3/27/2024 7:00 AM Syros Pharmaceuticals (SYRS): 3/27/2024 7:00 AM Precision BioSciences (DTIL): 3/27/2024 7:00 AM Local Bounti (LOCL): 3/27/2024 7:15 AM PDS Biotechnology (PDSB): 3/27/2024 7:30 AM UniFirst (UNF): 3/27/2024 8:00 AM More from the Next Earnings Dates Calendar Earnings History:PAVmed (PAVM): 3/26/2024 7:32 PMWillamette Valley (WVVI): 3/26/2024 5:30 PM PaySign (PAYS): 3/26/2024 5:15 PM GT Biopharma (GTBP): 3/26/2024 5:00 PM Bridgford Foods (BRID): 3/26/2024 5:00 PM NACCO Industries (NC): 3/26/2024 After close Wilhelmina International (WHLM): 3/26/2024 After close US Energy (USEG): 3/26/2024 After close Global Self Storage (SELF): 3/26/2024 After close Sidus Space (SIDU): 3/26/2024 After close More from the Earnings History archive |
| Earnings Peers |
| General Electric (GE) is categorized under the Industrials sector; to help you further research past earnings across stocks, below are some other companies in the same sector:
GENC Historical Earnings GEO Historical Earnings GETY Historical Earnings GFN Historical Earnings GGG Historical Earnings GHM Historical Earnings GLDD Historical Earnings GLW Historical Earnings GNK Historical Earnings GNRC Historical Earnings |
Click the button below for your complimentary copy of Your Early Retirement Portfolio: Dividends Up to 9.5%—Every Month—Forever.
You'll discover the details on 4 stocks and funds that pay you massive dividends as high as 9.5%.