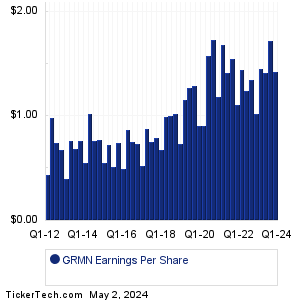
| Garmin Earnings History | |||||||||||||||||||||||||||||||||||||||||||||||||||||||||||||||||||||||||||||||||||||||||||||||||||||||||||||||||||||||||||||||||||||||||||||||||||
|
|
|
| Garmin Earnings History | |||||||||||||||||||||||||||||||||||||||||||||||||||||||||||||||||||||||||||||||||||||||||||||||||||||||||||||||||||||||||||||||||||||||||||||||||||
|
|
|
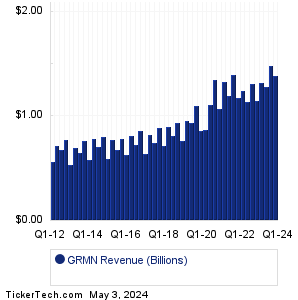
| GRMN Revenue History | |||||||||||||||||||||||||||||||||||||||||||||||||||||||||||||||||||||||||||||||||||||||||||||||||||||||||||||||||||||||||||||||||||||||||||||||||||
|
| GRMN Current Stock Quote |
Get Dividend Alerts Get SEC Filing Alerts |
| GRMN Stock Price Chart |
| Next Earnings Dates |
Next Earnings Date Calendar:22nd Century Group (XXII): 3/28/2024 6:00 AMMSC Industrial Direct Co (MSM): 3/28/2024 6:30 AM Walgreens Boots Alliance (WBA): 3/28/2024 7:00 AM REX American Resources (REX): 3/28/2024 7:00 AM OptimizeRx (OPRX): 3/28/2024 7:00 AM Bioventus (BVS): 3/28/2024 7:00 AM Altisource Portfolio (ASPS): 3/28/2024 7:00 AM Marketwise (MKTW): 3/28/2024 7:00 AM Data Storage (DTST): 3/28/2024 7:00 AM EVgo (EVGO): 3/28/2024 8:00 AM More from the Next Earnings Dates Calendar Earnings History:Creative Media (CMCT): 3/27/2024 7:20 PMChemours (CC): 3/27/2024 5:25 PM American Shared Hospital (AMS): 3/27/2024 5:12 PM inTest (INTT): 3/27/2024 5:07 PM Sonim Technologies (SONM): 3/27/2024 After close Vaxxinity (VAXX): 3/27/2024 After close Allied Gaming (AGAE): 3/27/2024 After close Microbot Medical (MBOT): 3/27/2024 After close Orchestra BioMed Hldgs (OBIO): 3/27/2024 After close Kingstone Companies (KINS): 3/27/2024 After close More from the Earnings History archive |
| Featured Articles |
| Earnings Peers |
| Garmin (GRMN) is categorized under the Consumer sector; to help you further research past earnings across stocks, below are some other companies in the same sector:
GRVI Past Earnings HAIN Past Earnings HAS Past Earnings HBB Past Earnings HBI Past Earnings HEAR Past Earnings HELE Past Earnings HIMS Past Earnings HLF Past Earnings HLLY Past Earnings |
Recommended: GREE Past Earnings, KIE market cap history, Funds Holding PCLN.
Click the button below for your complimentary copy of Your Early Retirement Portfolio: Dividends Up to 9.5%—Every Month—Forever.
You'll discover the details on 4 stocks and funds that pay you massive dividends as high as 9.5%.