| Friedman Industries Earnings History | |||||||||||||||||||||||||||||||||||||||||||||||||||||||||||||||||||||||||||||||||||||||||||||||||||||||||||||||||||||||||||||||||||||||||||||||||||

|
|
|
| Friedman Industries Earnings History | |||||||||||||||||||||||||||||||||||||||||||||||||||||||||||||||||||||||||||||||||||||||||||||||||||||||||||||||||||||||||||||||||||||||||||||||||||
|
|
|
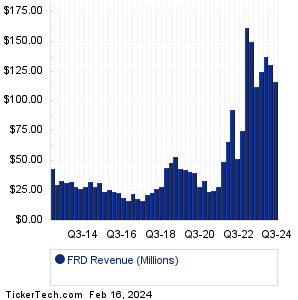
| FRD Revenue History | |||||||||||||||||||||||||||||||||||||||||||||||||||||||||||||||||||||||||||||||||||||||||||||||||||||||||||||||||||||||||||||||||||||||||||||||||||
|
| FRD Current Stock Quote |
Get Dividend Alerts Get SEC Filing Alerts |
| FRD Stock Price Chart |
| Next Earnings Dates |
Next Earnings Date Calendar:Portland Gen Electric (POR): 2/16/2024 5:00 AMMarcus & Millichap (MMI): 2/16/2024 6:16 AM Healthcare Realty Trust (HR): 2/16/2024 6:30 AM Barnes Gr (B): 2/16/2024 6:30 AM Cinemark Hldgs (CNK): 2/16/2024 6:30 AM AdvanSix (ASIX): 2/16/2024 6:30 AM Treehouse Foods (THS): 2/16/2024 6:55 AM Balchem (BCPC): 2/16/2024 7:00 AM Vulcan Materials (VMC): 2/16/2024 7:30 AM DT Midstream (DTM): 2/16/2024 7:30 AM More from the Next Earnings Dates Calendar Earnings History:Alliant Energy (LNT): 2/15/2024 6:00 PMConsolidated Edison (ED): 2/15/2024 5:00 PM PRA Group (PRAA): 2/15/2024 After close Cooper-Standard Holdings (CPS): 2/15/2024 After close Ingersoll Rand (IR): 2/15/2024 After close DraftKings (DKNG): 2/15/2024 After close Employers Holdings (EIG): 2/15/2024 After close Elme Communities (ELME): 2/15/2024 After close LTC Properties (LTC): 2/15/2024 After close Tronox Holdings (TROX): 2/15/2024 After close More from the Earnings History archive |
| Featured Articles |
| Earnings Peers |
Recommended: NSM Videos, PINC market cap history, APEX Options Chain.
Click the button below for your complimentary copy of Your Early Retirement Portfolio: Dividends Up to 9.5%—Every Month—Forever.
You'll discover the details on 4 stocks and funds that pay you massive dividends as high as 9.5%.