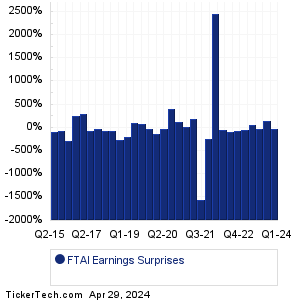
| FTAI Aviation Earnings Surprises | ||||||||||||||||||||||||||||||||||||||||||||||||||||||||||||||||||||||||||||||||||||||||||||||||||||||||||||||||
|
|
|
| FTAI Aviation Earnings Surprises | ||||||||||||||||||||||||||||||||||||||||||||||||||||||||||||||||||||||||||||||||||||||||||||||||||||||||||||||||
|
|
|
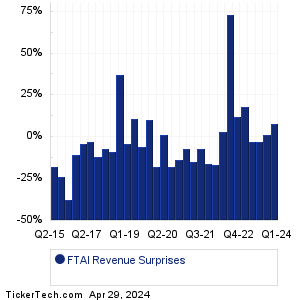
| FTAI Revenue Surprises | ||||||||||||||||||||||||||||||||||||||||||||||||||||||||||||||||||||||||||||||||||||||||||||||||||||||||||||||||
|
| FTAI Current Stock Quote |
Get Dividend Alerts Get SEC Filing Alerts |
| FTAI Stock Price Chart |
| Next Earnings Dates |
Next Earnings Date Calendar:Knightscope (KSCP): 4/28/2023 3:08 AMPortland Gen Electric (POR): 4/28/2023 5:00 AM Aon (AON): 4/28/2023 6:00 AM Ares Management (ARES): 4/28/2023 6:00 AM Chart Industries (GTLS): 4/28/2023 6:00 AM ArcBest (ARCB): 4/28/2023 6:00 AM Dime Community Bancshares (DCOM): 4/28/2023 6:00 AM MyMD Pharmaceuticals (MYMD): 4/28/2023 6:00 AM Avantor (AVTR): 4/28/2023 6:05 AM Carter's (CRI): 4/28/2023 6:05 AM More from the Next Earnings Dates Calendar Earnings History:NorthWestern (NWE): 4/27/2023 6:00 PMRiverview Bancorp (RVSB): 4/27/2023 5:30 PM TFS Financial (TFSL): 4/27/2023 5:24 PM Old Point Financial (OPOF): 4/27/2023 5:20 PM Oil States International (OIS): 4/27/2023 5:15 PM Essex Property Trust (ESS): 4/27/2023 5:02 PM Minerals Technologies (MTX): 4/27/2023 5:01 PM Blue Ridge Bankshares (BRBS): 4/27/2023 5:00 PM Primis Finl (FRST): 4/27/2023 5:00 PM Customers Bancorp (CUBI): 4/27/2023 5:00 PM More from the Earnings History archive |
| Earnings Peers |
| FTAI Aviation (FTAI) is categorized under the Industrials sector; to help you further research past earnings across stocks, below are some other companies in the same sector:
FTEK Historical Earnings FTV Historical Earnings FWRD Historical Earnings FXLV Historical Earnings GATX Historical Earnings GBX Historical Earnings GD Historical Earnings GE Historical Earnings GENC Historical Earnings GEO Historical Earnings |
Recommended: ELY Insider Buying, Funds Holding BCAN, VTOL Videos.