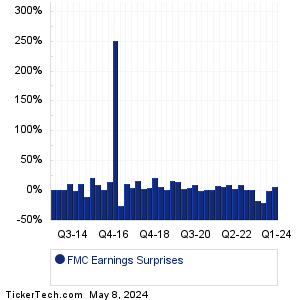
| FMC Earnings Surprises | ||||||||||||||||||||||||||||||||||||||||||||||||||||||||||||||||||||||||||||||||||||||||||||||||||||||||||||||||||||||||||||||||||||||||||||||||||||||||||||||||
|
|
|
| FMC Earnings Surprises | ||||||||||||||||||||||||||||||||||||||||||||||||||||||||||||||||||||||||||||||||||||||||||||||||||||||||||||||||||||||||||||||||||||||||||||||||||||||||||||||||
|
|
|
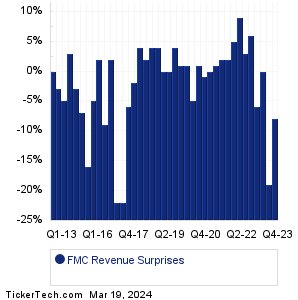
| FMC Revenue Surprises | ||||||||||||||||||||||||||||||||||||||||||||||||||||||||||||||||||||||||||||||||||||||||||||||||||||||||||||||||||||||||||||||||||||||||||||||||||||||||||||||||
|
| FMC Current Stock Quote |
Get Dividend Alerts Get SEC Filing Alerts |
| FMC Stock Price Chart |
| Next Earnings Dates |
Next Earnings Date Calendar:BowFlex (BFX): 3/19/2024 4:41 AMCiti Trends (CTRN): 3/19/2024 6:45 AM Caleres (CAL): 3/19/2024 6:45 AM Core & Main (CNM): 3/19/2024 7:30 AM Vitesse Energy (VTS): 3/19/2024 After close National Presto Indus (NPK): 3/19/2024 After close TeraWulf (WULF): 3/19/2024 After close Taysha Gene Therapies (TSHA): 3/19/2024 After close Precigen (PGEN): 3/19/2024 After close Array Technologies (ARRY): 3/19/2024 After close More from the Next Earnings Dates Calendar Earnings History:Comtech Telecom (CMTL): 3/18/2024 After closeFreightCar America (RAIL): 3/18/2024 After close Alpine Immune Sciences (ALPN): 3/18/2024 After close Tenaya Therapeutics (TNYA): 3/18/2024 After close Singular Genomics Sys (OMIC): 3/18/2024 After close Eyenovia (EYEN): 3/18/2024 After close Adverum Biotechnologies (ADVM): 3/18/2024 After close RF Industries (RFIL): 3/18/2024 After close National CineMedia (NCMI): 3/18/2024 After close Lantern Pharma (LTRN): 3/18/2024 After close More from the Earnings History archive |
| Earnings Peers |
| FMC (FMC) is categorized under the Materials sector; to help you further research past earnings across stocks, below are some other companies in the same sector:
FND Historical Earnings FOE Historical Earnings FORD Historical Earnings FRTA Historical Earnings FSTR Historical Earnings FTK Historical Earnings FUL Historical Earnings G Historical Earnings GATO Historical Earnings GCP Historical Earnings |
Recommended: GNRT Insider Buying, TMO Average Annual Return, HBNC Dividend Growth Rate.
Click the button below for your complimentary copy of Your Early Retirement Portfolio: Dividends Up to 9.5%—Every Month—Forever.
You'll discover the details on 4 stocks and funds that pay you massive dividends as high as 9.5%.