Fluidigm Earnings Surprises image   This FLDM earnings surprises page last updated 2/21/2022
Fluidigm Earnings Surprises Chart
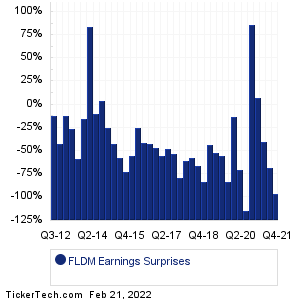
Data adjusted for FLDM split history

PeriodExpectedActualSurprise
Q4 2021 -0.28 -0.01 +0.27 (-96%)
Q3 2021 -0.22 -0.07 +0.15 (-68%)
Q2 2021 -0.20 -0.12 +0.08 (-40%)
Q1 2021 -0.14 -0.15 -0.01 (+7%)
Q4 2020 -0.07 -0.13 -0.06 (+86%)
Q3 2020 -0.20 0.03 +0.23 (-115%)
Q2 2020 -0.23 -0.07 +0.16 (-70%)
Q1 2020 -0.15 -0.13 +0.02 (-13%)
Q4 2019 -0.19 -0.03 +0.16 (-84%)
Q3 2019 -0.20 -0.09 +0.11 (-55%)
Q2 2019 -0.21 -0.10 +0.11 (-52%)
Q1 2019 -0.25 -0.14 +0.11 (-44%)
Q4 2018 -0.35 -0.06 +0.29 (-83%)
Q3 2018 -0.38 -0.13 +0.25 (-66%)
Q2 2018 -0.40 -0.17 +0.23 (-58%)
Q1 2018 -0.41 -0.16 +0.25 (-61%)
Q4 2017 -0.39 -0.08 +0.31 (-79%)
Q3 2017 -0.53 -0.25 +0.28 (-53%)
Q2 2017 -0.60 -0.31 +0.29 (-48%)
Q1 2017 -0.73 -0.33 +0.40 (-55%)
Q4 2016 -0.60 -0.32 +0.28 (-47%)
Q3 2016 -0.67 -0.38 +0.29 (-43%)
Q2 2016 -0.58 -0.34 +0.24 (-41%)
Q1 2016 -0.53 -0.40 +0.13 (-25%)
Q4 2015 -0.53 -0.24 +0.29 (-55%)
Q3 2015 -0.55 -0.15 +0.40 (-73%)
Q2 2015 -0.48 -0.20 +0.28 (-58%)
Q1 2015 -0.44 -0.25 +0.19 (-43%)
Q4 2014 -0.52 -0.39 +0.13 (-25%)
Q3 2014 -0.47 -0.49 -0.02 (+4%)
Q2 2014 -0.50 -0.45 +0.05 (-10%)
Q1 2014 -0.31 -0.57 -0.26 (+84%)
Q3 2013 -0.20 -0.17 +0.03 (-15%)
Q2 2013 -0.17 -0.07 +0.10 (-59%)
Q1 2013 -0.19 -0.14 +0.05 (-26%)
Q4 2012 -0.16 -0.14 +0.02 (-12%)
Q3 2012 -0.21 -0.12 +0.09 (-43%)
Q2 2012 -0.25 -0.22 +0.03 (-12%)
Fluidigm Revenue Surprises Chart
PeriodExpectedActualSurprise
Q4 2021 32.70M 38.27M +5.57M (+17%)
Q3 2021 30.00M 28.50M -1.50M (-5%)
Q2 2021 30.57M 31.02M +448000 (+1%)
Q1 2021 31.97M 32.79M +824000 (+3%)
Q4 2020 50.72M 44.61M -6.11M (-12%)
Q3 2020 32.46M 39.86M +7.40M (+23%)
Q2 2020 19.07M 26.06M +6.99M (+37%)
Q1 2020 29.03M 27.62M -1.41M (-5%)
Q4 2019 30.84M 32.44M +1.60M (+5%)
Q3 2019 28.74M 26.50M -2.24M (-8%)
Q2 2019 30.06M 28.20M -1.86M (-6%)
Q1 2019 29.20M 30.11M +911000 (+3%)
Q4 2018 30.55M 32.33M +1.77M (+6%)
Q3 2018 27.34M 28.96M +1.62M (+6%)
Q2 2018 26.30M 26.43M +128000 (0%)
Q1 2018 25.63M 25.25M -0.38M (-1%)
Q4 2017 27.14M 27.75M +605000 (+2%)
Q3 2017 25.54M 24.75M -0.79M (-3%)
Q2 2017 23.50M 23.91M +412000 (+2%)
Q1 2017 25.02M 25.53M +513000 (+2%)
Q4 2016 26.33M 25.08M -1.25M (-5%)
Q3 2016 27.75M 22.19M -5.56M (-20%)
Q2 2016 29.52M 28.17M -1.35M (-5%)
Q1 2016 26.95M 29.00M +2.05M (+8%)
Q4 2015 29.91M 30.72M +812000 (+3%)
Q3 2015 27.53M 28.64M +1.11M (+4%)
Q2 2015 30.43M 28.62M -1.81M (-6%)
Q1 2015 30.70M 26.73M -3.97M (-13%)
Q4 2014 33.41M 33.49M +80000 (0%)
Q3 2014 29.17M 29.64M +465000 (+2%)
Q2 2014 27.13M 27.60M +470000 (+2%)
Q1 2014 22.91M 25.70M +2.79M (+12%)
Q3 2013 16.73M 18.30M +1.57M (+9%)
Q2 2013 15.88M 17.50M +1.62M (+10%)
Q1 2013 14.32M 14.50M +180000 (+1%)
Q4 2012 14.70M 15.70M +1.00M (+7%)
Q3 2012 13.35M 12.80M -0.55M (-4%)
Q2 2012 12.47M 12.90M +430000 (+3%)
Quotes delayed 20 minutes

Email EnvelopeFree FLDM Email Alerts:
Get Dividend Alerts
Get SEC Filing Alerts
10 Most Oversold S&P 500 Stocks
10 Most Overbought S&P 500 Stocks
10 ETFs With Stocks Insiders Are Buying
10 ETFs With Most Upside To Targets
The DividendRank Top 25
Warren Buffett Dividend Stocks
10 Cheap Dividend Stocks Under $10
10 Top DividendRank'ed Energy Stocks
The 10 Highest Yielding Preferred Stocks
The 15 Most Active S&P Call & Put Options

Next Earnings Date Calendar:

William Penn (WMPN): 2/21/2022 8:00 AM
Sun Communities (SUI): 2/21/2022 After close
Proassurance (PRA): 2/21/2022 After close
NexTier Oilfield (NEX): 2/21/2022 After close
Apache (APA): 2/21/2022 After close
Masonite International (DOOR): 2/21/2022 After close
Unisys (UIS): 2/21/2022 After close
Williams Companies (WMB): 2/21/2022 After close
Helix Energy Solutions Gr (HLX): 2/21/2022 After close
HealthStream (HSTM): 2/21/2022 After close

More from the Next Earnings Dates Calendar

Earnings History:

Lions Gate Entertainment Corporation Class B Non-Voting Shares (LGF-B): 2/20/2022 After close
NeuroPace (NPCE): 2/20/2022 4:14 AM
HireRight Holdings (HRT): 2/19/2022 5:56 PM
Minerva Surgical (UTRS): 2/19/2022 After close
GT Biopharma (GTBP): 2/19/2022 7:10 AM
Rivian Automotive (RIVN): 2/19/2022 5:03 AM
Catalyst Bancorp (CLST): 2/19/2022 3:45 AM
Virginia National (VABK): 2/18/2022 5:24 PM
First Advantage (FA): 2/18/2022 5:23 PM
HV Bancorp (HVBC): 2/18/2022 5:00 PM

More from the Earnings History archive
Fluidigm (FLDM) is categorized under the Healthcare sector; to help you further research past earnings across stocks, below are some other companies in the same sector:

FLGT Past Earnings
FLXN Past Earnings
FMTX Past Earnings
FNCH Past Earnings
FOLD Past Earnings
FONR Past Earnings
FREQ Past Earnings
FSTX Past Earnings
FULC Past Earnings
FVE Past Earnings
On this page we presented the FLDM earnings surprises information for Fluidigm, comparing the expected earnings versus the actual earnings quarter by quarter, with the resulting positive or negative percentage surprise. Any self directed investor doing their due diligence on FLDM (or any other given stock) can benefit from researching all of the Fluidigm past earnings going backwards in time, including how often the company beat or missed the market's expectations. To help you with this Fluidigm earnings surprise research, on this page we presented each quarter's resulting numbers for easy comparison. Studying these numbers can help an investor by providing important context with which to think about FLDM's next earnings report. In your continued research on Fluidigm we hope you will be sure to check out the further links included for revenue and earnings history as well as next earnings dates for FLDM. Thanks for visiting, and the next time you need to research FLDM earnings surprises or those of another stock, we hope you'll think of our site as your go-to earnings surprises research resource of choice.

Recommended: FLIC market cap history, ITT shares outstanding history, ADM Videos.


Fluidigm Earnings Surprises | www.NextEarningsDate.com | Copyright © 2020 - 2022, All Rights Reserved

Nothing in NextEarningsDate.com is intended to be investment advice, nor does it represent the opinion of, counsel from, or recommendations by BNK Invest Inc. or any of its affiliates, subsidiaries or partners. None of the information contained herein constitutes a recommendation that any particular security, portfolio, transaction, or investment strategy is suitable for any specific person. All viewers agree that under no circumstances will BNK Invest, Inc,. its subsidiaries, partners, officers, employees, affiliates, or agents be held liable for any loss or damage caused by your reliance on information obtained. By visiting, using or viewing this site, you agree to the following Full Disclaimer & Terms of Use and Privacy Policy. Video widget and market videos powered by Market News Video. Quote and option data delayed at least 15 minutes; stock quote data powered by Ticker Technologies, and Mergent.