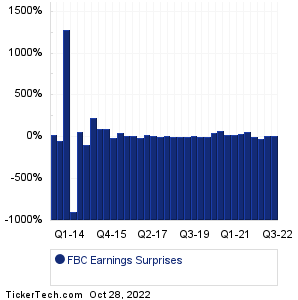
| Flagstar Bancorp Earnings Surprises | ||||||||||||||||||||||||||||||||||||||||||||||||||||||||||||||||||||||||||||||||||||||||||||||||||||||||||||||||||||||||||||||||||||||||||||
|
|
|
| Flagstar Bancorp Earnings Surprises | ||||||||||||||||||||||||||||||||||||||||||||||||||||||||||||||||||||||||||||||||||||||||||||||||||||||||||||||||||||||||||||||||||||||||||||
|
|
|
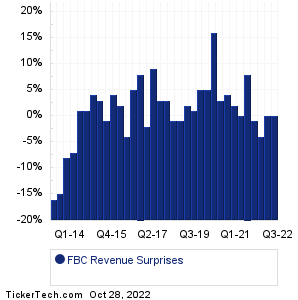
| FBC Revenue Surprises | ||||||||||||||||||||||||||||||||||||||||||||||||||||||||||||||||||||||||||||||||||||||||||||||||||||||||||||||||||||||||||||||||||||||||||||
|
| FBC Current Stock Quote |
Get Dividend Alerts Get SEC Filing Alerts |
| FBC Stock Price Chart |
| Next Earnings Dates |
Next Earnings Date Calendar:Chevron (CVX): 10/28/2022 6:00 AMAon (AON): 10/28/2022 6:00 AM Chart Industries (GTLS): 10/28/2022 6:00 AM Dime Community Bancshares (DCOM): 10/28/2022 6:00 AM Carter's (CRI): 10/28/2022 6:10 AM Exxon Mobil (XOM): 10/28/2022 6:30 AM LyondellBasell Industries (LYB): 10/28/2022 6:30 AM nVent Electric (NVT): 10/28/2022 6:30 AM Barnes Gr (B): 10/28/2022 6:30 AM Booz Allen Hamilton (BAH): 10/28/2022 6:45 AM More from the Next Earnings Dates Calendar Earnings History:First Savings Financial (FSFG): 10/27/2022 5:45 PMHeritage Commerce (HTBK): 10/27/2022 5:44 PM First Bancshares (FBMS): 10/27/2022 5:15 PM TFS Financial (TFSL): 10/27/2022 5:08 PM Minerals Technologies (MTX): 10/27/2022 5:01 PM U.S. Century Bank (USCB): 10/27/2022 5:00 PM Blue Ridge Bankshares (BRBS): 10/27/2022 5:00 PM Oil States International (OIS): 10/27/2022 5:00 PM Primis Finl (FRST): 10/27/2022 5:00 PM AptarGroup (ATR): 10/27/2022 5:00 PM More from the Earnings History archive |
| Earnings Peers |
| Flagstar Bancorp (FBC) is categorized under the Financials sector; to help you further research past earnings across stocks, below are some other companies in the same sector:
FBIZ Historical Earnings FBK Historical Earnings FBMS Historical Earnings FBNC Historical Earnings FBP Historical Earnings FCAP Historical Earnings FCBC Historical Earnings FCBP Historical Earnings FCCO Historical Earnings FCCY Historical Earnings |
Recommended: SAH shares outstanding history, MONY Videos, NVEC Split History.