Facebook Earnings Surprises image   This FB earnings surprises page last updated 11/2/2021
Facebook Earnings Surprises Chart
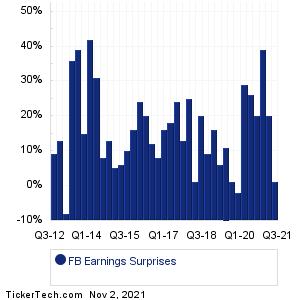
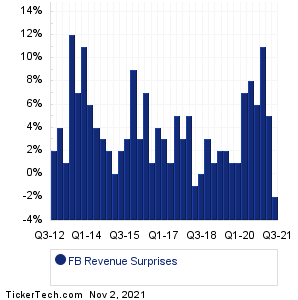
Data adjusted for FB split history

PeriodExpectedActualSurprise
Q3 2021 3.19 3.22 +0.03 (+1%)
Q2 2021 3.02 3.61 +0.59 (+20%)
Q1 2021 2.37 3.30 +0.93 (+39%)
Q4 2020 3.22 3.88 +0.66 (+20%)
Q3 2020 1.91 2.40 +0.49 (+26%)
Q2 2020 1.39 1.80 +0.41 (+29%)
Q1 2020 1.74 1.71 -0.03 (-2%)
Q4 2019 2.53 2.56 +0.03 (+1%)
Q3 2019 1.91 2.12 +0.21 (+11%)
Q2 2019 1.87 1.99 +0.12 (+6%)
Q1 2019 1.63 1.89 +0.26 (+16%)
Q4 2018 2.19 2.38 +0.19 (+9%)
Q3 2018 1.47 1.76 +0.29 (+20%)
Q2 2018 1.72 1.74 +0.02 (+1%)
Q1 2018 1.35 1.69 +0.34 (+25%)
Q4 2017 1.95 2.21 +0.26 (+13%)
Q3 2017 1.28 1.59 +0.31 (+24%)
Q2 2017 1.12 1.32 +0.20 (+18%)
Q1 2017 1.12 1.30 +0.18 (+16%)
Q4 2016 1.30 1.41 +0.11 (+8%)
Q3 2016 0.97 1.09 +0.12 (+12%)
Q2 2016 0.81 0.97 +0.16 (+20%)
Q1 2016 0.62 0.77 +0.15 (+24%)
Q4 2015 0.68 0.79 +0.11 (+16%)
Q3 2015 0.52 0.57 +0.05 (+10%)
Q2 2015 0.47 0.50 +0.03 (+6%)
Q1 2015 0.40 0.42 +0.02 (+5%)
Q4 2014 0.48 0.54 +0.06 (+13%)
Q3 2014 0.40 0.43 +0.03 (+8%)
Q2 2014 0.32 0.42 +0.10 (+31%)
Q1 2014 0.24 0.34 +0.10 (+42%)
Q4 2013 0.27 0.31 +0.04 (+15%)
Q3 2013 0.18 0.25 +0.07 (+39%)
Q2 2013 0.14 0.19 +0.05 (+36%)
Q1 2013 0.13 0.12 -0.01 (-8%)
Q4 2012 0.15 0.17 +0.02 (+13%)
Q3 2012 0.11 0.12 +0.01 (+9%)
Facebook Revenue Surprises Chart
PeriodExpectedActualSurprise
Q3 2021 29.58B 29.01B -0.57B (-2%)
Q2 2021 27.82B 29.08B +1.26B (+5%)
Q1 2021 23.67B 26.17B +2.50B (+11%)
Q4 2020 26.43B 28.07B +1.64B (+6%)
Q3 2020 19.82B 21.47B +1.65B (+8%)
Q2 2020 17.40B 18.69B +1.29B (+7%)
Q1 2020 17.48B 17.74B +257.00M (+1%)
Q4 2019 20.88B 21.08B +202.00M (+1%)
Q3 2019 17.36B 17.65B +292.00M (+2%)
Q2 2019 16.51B 16.89B +376.00M (+2%)
Q1 2019 14.97B 15.08B +107.00M (+1%)
Q4 2018 16.41B 16.91B +504.00M (+3%)
Q3 2018 13.79B 13.73B -63.00M (-0%)
Q2 2018 13.36B 13.23B -0.13B (-1%)
Q1 2018 11.41B 11.97B +556.00M (+5%)
Q4 2017 12.55B 12.97B +422.00M (+3%)
Q3 2017 9.83B 10.33B +498.00M (+5%)
Q2 2017 9.19B 9.32B +131.00M (+1%)
Q1 2017 7.82B 8.03B +212.00M (+3%)
Q4 2016 8.49B 8.81B +319.00M (+4%)
Q3 2016 6.92B 7.01B +91.00M (+1%)
Q2 2016 6.02B 6.44B +416.00M (+7%)
Q1 2016 5.25B 5.38B +132.00M (+2%)
Q4 2015 5.36B 5.84B +481.00M (+9%)
Q3 2015 4.37B 4.50B +131.00M (+3%)
Q2 2015 3.98B 4.04B +62.00M (+2%)
Q1 2015 3.55B 3.54B -7.00M (-0%)
Q4 2014 3.77B 3.85B +81.00M (+2%)
Q3 2014 3.11B 3.20B +90.00M (+3%)
Q2 2014 2.81B 2.91B +100.00M (+4%)
Q1 2014 2.35B 2.50B +150.00M (+6%)
Q4 2013 2.33B 2.59B +260.00M (+11%)
Q3 2013 1.89B 2.02B +130.00M (+7%)
Q2 2013 1.61B 1.81B +200.00M (+12%)
Q1 2013 1.44B 1.46B +20.00M (+1%)
Q4 2012 1.53B 1.59B +60.00M (+4%)
Q3 2012 1.23B 1.26B +30.00M (+2%)
Quotes delayed 20 minutes

Email EnvelopeFree FB Email Alerts:
Get Dividend Alerts
Get SEC Filing Alerts
10 Most Oversold S&P 500 Stocks
10 Most Overbought S&P 500 Stocks
10 ETFs With Stocks Insiders Are Buying
10 ETFs With Most Upside To Targets
The DividendRank Top 25
Warren Buffett Dividend Stocks
10 Cheap Dividend Stocks Under $10
10 Top DividendRank'ed Energy Stocks
The 10 Highest Yielding Preferred Stocks
The 15 Most Active S&P Call & Put Options

Next Earnings Date Calendar:

DuPont de Nemours (DD): 11/2/2021 6:00 AM
Generac Hldgs (GNRC): 11/2/2021 6:00 AM
Gartner (IT): 11/2/2021 6:00 AM
Leidos Holdings (LDOS): 11/2/2021 6:00 AM
Lear (LEA): 11/2/2021 6:00 AM
Louisiana-Pacific (LPX): 11/2/2021 6:00 AM
Ingredion (INGR): 11/2/2021 6:00 AM
Integra Lifesciences (IART): 11/2/2021 6:00 AM
ExlService Holdings (EXLS): 11/2/2021 6:00 AM
ArcBest (ARCB): 11/2/2021 6:00 AM

More from the Next Earnings Dates Calendar

Earnings History:

Adtran (ADTN): 11/1/2021 8:05 PM
Douglas Dynamics (PLOW): 11/1/2021 6:00 PM
Otter Tail (OTTR): 11/1/2021 6:00 PM
CVR Energy (CVI): 11/1/2021 5:15 PM
Archrock (AROC): 11/1/2021 5:00 PM
MidWestOne Financial Gr (MOFG): 11/1/2021 After close
Intrepid Potash (IPI): 11/1/2021 After close
Weis Markets (WMK): 11/1/2021 After close
Centerspace (CSR): 11/1/2021 After close
Weatherford International (WFRD): 11/1/2021 After close

More from the Earnings History archive
Facebook (FB) is categorized under the Services sector; to help you further research past earnings across stocks, below are some other companies in the same sector:

FCFS Past Earnings
FIVE Past Earnings
FL Past Earnings
FLL Past Earnings
FLNT Past Earnings
FLWS Past Earnings
FOX Past Earnings
FOXA Past Earnings
FPAY Past Earnings
FRG Past Earnings
On this page we presented the FB earnings surprises information for Facebook, comparing the expected earnings versus the actual earnings quarter by quarter, with the resulting positive or negative percentage surprise. Any self directed investor doing their due diligence on FB (or any other given stock) can benefit from researching all of the Facebook past earnings going backwards in time, including how often the company beat or missed the market's expectations. To help you with this Facebook earnings surprise research, on this page we presented each quarter's resulting numbers for easy comparison. Studying these numbers can help an investor by providing important context with which to think about FB's next earnings report. In your continued research on Facebook we hope you will be sure to check out the further links included for revenue and earnings history as well as next earnings dates for FB. Thanks for visiting, and the next time you need to research FB earnings surprises or those of another stock, we hope you'll think of our site as your go-to earnings surprises research resource of choice.
 

Facebook Earnings Surprises | www.NextEarningsDate.com | Copyright © 2020 - 2021, All Rights Reserved

Nothing in NextEarningsDate.com is intended to be investment advice, nor does it represent the opinion of, counsel from, or recommendations by BNK Invest Inc. or any of its affiliates, subsidiaries or partners. None of the information contained herein constitutes a recommendation that any particular security, portfolio, transaction, or investment strategy is suitable for any specific person. All viewers agree that under no circumstances will BNK Invest, Inc,. its subsidiaries, partners, officers, employees, affiliates, or agents be held liable for any loss or damage caused by your reliance on information obtained. By visiting, using or viewing this site, you agree to the following Full Disclaimer & Terms of Use and Privacy Policy. Video widget and market videos powered by Market News Video. Quote and option data delayed at least 15 minutes; stock quote data powered by Ticker Technologies, and Mergent.