ETH Earnings Surprises image   This page last updated 8/11/2021
ETH Earnings Surprises Chart
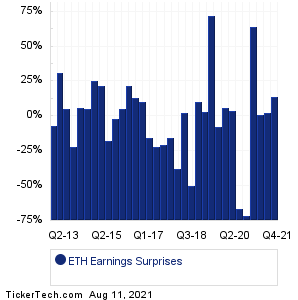
Data adjusted for ETH split history

PeriodExpectedActualSurprise
Q4 2021 0.65 0.74 +0.09 (+14%)
Q3 2021 0.57 0.58 +0.01 (+2%)
Q2 2021 0.68 0.69 +0.01 (+1%)
Q1 2021 0.22 0.36 +0.14 (+64%)
Q4 2020 -0.54 -0.15 +0.39 (-72%)
Q3 2020 0.06 0.02 -0.04 (-67%)
Q2 2020 0.26 0.27 +0.01 (+4%)
Q1 2020 0.33 0.35 +0.02 (+6%)
Q4 2019 0.50 0.46 -0.04 (-8%)
Q3 2019 0.18 0.31 +0.13 (+72%)
Q1 2019 0.32 0.33 +0.01 (+3%)
Q4 2018 0.39 0.43 +0.04 (+10%)
Q3 2018 0.22 0.11 -0.11 (-50%)
Q2 2018 0.52 0.53 +0.01 (+2%)
Q1 2018 0.45 0.28 -0.17 (-38%)
Q4 2017 0.50 0.42 -0.08 (-16%)
Q3 2017 0.29 0.23 -0.06 (-21%)
Q2 2017 0.50 0.39 -0.11 (-22%)
Q1 2017 0.51 0.43 -0.08 (-16%)
Q4 2016 0.52 0.57 +0.05 (+10%)
Q3 2016 0.30 0.34 +0.04 (+13%)
Q2 2016 0.45 0.55 +0.10 (+22%)
Q1 2016 0.44 0.46 +0.02 (+5%)
Q4 2015 0.44 0.43 -0.01 (-2%)
Q2 2015 0.45 0.37 -0.08 (-18%)
Q1 2015 0.36 0.44 +0.08 (+22%)
Q4 2014 0.40 0.50 +0.10 (+25%)
Q3 2014 0.21 0.22 +0.01 (+5%)
Q1 2014 0.31 0.33 +0.02 (+6%)
Q3 2013 0.27 0.21 -0.06 (-22%)
Q2 2013 0.37 0.39 +0.02 (+5%)
Q1 2013 0.29 0.38 +0.09 (+31%)
Q4 2012 0.29 0.27 -0.02 (-7%)
ETH Revenue Surprises Chart
PeriodExpectedActualSurprise
Q4 2021 177.90M 178.32M +423000 (0%)
Q3 2021 177.00M 176.96M -38000 (-0%)
Q2 2021 178.80M 178.83M +26000 (0%)
Q1 2021 144.32M 151.06M +6.74M (+5%)
Q4 2020 95.17M 91.57M -3.60M (-4%)
Q3 2020 152.09M 149.77M -2.32M (-2%)
Q2 2020 174.65M 174.57M -76000 (-0%)
Q1 2020 176.88M 173.92M -2.96M (-2%)
Q4 2019 198.23M 183.92M -14.31M (-7%)
Q3 2019 181.13M 177.83M -3.30M (-2%)
Q1 2019 184.84M 187.78M +2.94M (+2%)
Q4 2018 200.05M 205.58M +5.53M (+3%)
Q3 2018 185.43M 181.42M -4.01M (-2%)
Q2 2018 211.93M 198.48M -13.45M (-6%)
Q1 2018 198.88M 181.30M -17.58M (-9%)
Q4 2017 201.56M 194.93M -6.63M (-3%)
Q3 2017 186.57M 180.50M -6.07M (-3%)
Q2 2017 208.83M 194.67M -14.16M (-7%)
Q1 2017 197.07M 193.29M -3.78M (-2%)
Q4 2016 200.28M 205.69M +5.41M (+3%)
Q3 2016 182.75M 190.58M +7.83M (+4%)
Q2 2016 203.95M 207.53M +3.58M (+2%)
Q1 2016 198.83M 190.39M -8.44M (-4%)
Q4 2015 204.36M 193.57M -10.79M (-5%)
Q2 2015 202.68M 197.07M -5.61M (-3%)
Q1 2015 191.27M 190.70M -0.57M (-0%)
Q4 2014 192.25M 198.80M +6.55M (+3%)
Q3 2014 170.95M 173.10M +2.15M (+1%)
Q1 2014 181.46M 181.70M +240000 (0%)
Q3 2013 180.17M 168.10M -12.07M (-7%)
Q2 2013 190.80M 191.30M +500000 (0%)
Q1 2013 190.87M 187.40M -3.47M (-2%)
Q4 2012 190.42M 185.30M -5.12M (-3%)
Quotes delayed 20 minutes
Get Free SEC filing alerts for ETH:
ETH SEC Filing Email Alerts ServiceExternal link
10 Most Oversold S&P 500 Stocks
10 Most Overbought S&P 500 Stocks
10 ETFs With Stocks Insiders Are Buying
10 ETFs With Most Upside To Targets
The DividendRank Top 25
Warren Buffett Dividend Stocks
10 Cheap Dividend Stocks Under $10
10 Top DividendRank'ed Energy Stocks
The 10 Highest Yielding Preferred Stocks
The 15 Most Active S&P Call & Put Options

Next Earnings Date Calendar:

Haemonetics (HAE): 8/11/2021 6:00 AM
Berkeley Lights (BLI): 8/11/2021 6:00 AM
Wireless Telecom Group (WTT): 8/11/2021 6:25 AM
Perrigo Co (PRGO): 8/11/2021 6:30 AM
Cerevel Therapeutics Hldg (CERE): 8/11/2021 6:30 AM
FTC Solar (FTCI): 8/11/2021 6:30 AM
Crown Crafts (CRWS): 8/11/2021 6:45 AM
Royalty Pharma (RPRX): 8/11/2021 7:00 AM
Wendy's (WEN): 8/11/2021 7:00 AM
APi Gr (APG): 8/11/2021 7:00 AM

More from the Next Earnings Dates Calendar

Earnings History:

SandRidge Energy (SD): 8/10/2021 5:42 PM
Psychemedics (PMD): 8/10/2021 5:10 PM
Signify Health (SGFY): 8/10/2021 5:00 PM
Allena Pharmaceuticals (ALNA): 8/10/2021 After close
Paymentus Holdings (PAY): 8/10/2021 After close
K12 (LRN): 8/10/2021 After close
Fuel Tech (FTEK): 8/10/2021 After close
Relmada Therapeutics (RLMD): 8/10/2021 After close
McAfee (MCFE): 8/10/2021 After close
Gulf Island Fabrication (GIFI): 8/10/2021 After close

More from the Earnings History archive
 

ETH Earnings Surprises | www.NextEarningsDate.com | Copyright © 2020 - 2021, All Rights Reserved

Nothing in NextEarningsDate.com is intended to be investment advice, nor does it represent the opinion of, counsel from, or recommendations by BNK Invest Inc. or any of its affiliates, subsidiaries or partners. None of the information contained herein constitutes a recommendation that any particular security, portfolio, transaction, or investment strategy is suitable for any specific person. All viewers agree that under no circumstances will BNK Invest, Inc,. its subsidiaries, partners, officers, employees, affiliates, or agents be held liable for any loss or damage caused by your reliance on information obtained. By visiting, using or viewing this site, you agree to the following Full Disclaimer & Terms of Use and Privacy Policy. Video widget and market videos powered by Market News Video. Quote and option data delayed at least 15 minutes; stock quote data powered by Ticker Technologies, and Mergent.