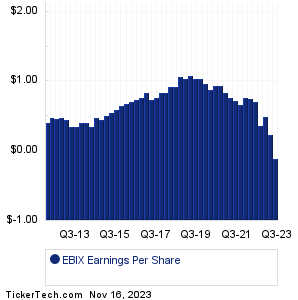
| Ebix Earnings History | ||||||||||||||||||||||||||||||||||||||||||||||||||||||||||||||||||||||||||||||||||||||||||||||||||||||||||||||||||||||||||||||||||||||||||||||||
|
|
|
| Ebix Earnings History | ||||||||||||||||||||||||||||||||||||||||||||||||||||||||||||||||||||||||||||||||||||||||||||||||||||||||||||||||||||||||||||||||||||||||||||||||
|
|
|
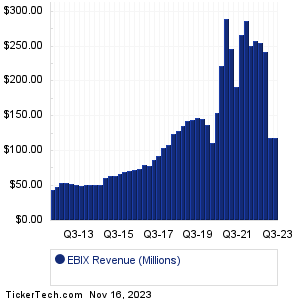
| EBIX Revenue History | ||||||||||||||||||||||||||||||||||||||||||||||||||||||||||||||||||||||||||||||||||||||||||||||||||||||||||||||||||||||||||||||||||||||||||||||||
|
| EBIX Current Stock Quote |
Get Dividend Alerts Get SEC Filing Alerts |
| EBIX Stock Price Chart |
| Next Earnings Dates |
Next Earnings Date Calendar:Bath & Body Works (BBWI): 11/16/2023 6:00 AMShoe Carnival (SCVL): 11/16/2023 6:15 AM BrightView Hldgs (BV): 11/16/2023 6:15 AM Macy's (M): 11/16/2023 6:55 AM Walmart (WMT): 11/16/2023 7:00 AM Berry Global Gr (BERY): 11/16/2023 7:00 AM Spire (SR): 11/16/2023 7:00 AM Brady (BRC): 11/16/2023 7:00 AM Children's Place (PLCE): 11/16/2023 7:00 AM OneWater Marine (ONEW): 11/16/2023 7:00 AM More from the Next Earnings Dates Calendar Earnings History:America's Car-Mart (CRMT): 11/15/2023 5:00 PMBattalion Oil (BATL): 11/15/2023 After close Pure Cycle (PCYO): 11/15/2023 After close Maximus (MMS): 11/15/2023 After close Hillenbrand (HI): 11/15/2023 After close RMR Gr (RMR): 11/15/2023 After close EZCORP (EZPW): 11/15/2023 After close StoneX Group (SNEX): 11/15/2023 After close J&J Snack Foods (JJSF): 11/15/2023 After close i3 Verticals (IIIV): 11/15/2023 After close More from the Earnings History archive |
| Featured Articles |
| Earnings Peers |
| Ebix (EBIX) is categorized under the Technology sector; to help you further research past earnings across stocks, below are some other companies in the same sector:
ECOM Past Earnings EGAN Past Earnings EGHT Past Earnings EGIO Past Earnings EMKR Past Earnings ENFN Past Earnings ENPH Past Earnings ENTG Past Earnings ENV Past Earnings EPAM Past Earnings |
Click the button below for your complimentary copy of Your Early Retirement Portfolio: Dividends Up to 9.5%—Every Month—Forever.
You'll discover the details on 4 stocks and funds that pay you massive dividends as high as 9.5%.