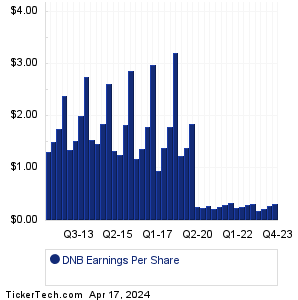
| Dun & Bradstreet Hldgs Earnings History | ||||||||||||||||||||||||||||||||||||||||||||||||||||||||||||||||||||||||||||||||||||||||||||||||||||||||||||||||||||||||
|
|
|
| Dun & Bradstreet Hldgs Earnings History | ||||||||||||||||||||||||||||||||||||||||||||||||||||||||||||||||||||||||||||||||||||||||||||||||||||||||||||||||||||||||
|
|
|
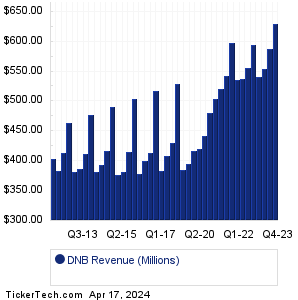
| DNB Revenue History | ||||||||||||||||||||||||||||||||||||||||||||||||||||||||||||||||||||||||||||||||||||||||||||||||||||||||||||||||||||||||
|
| DNB Current Stock Quote |
Get Dividend Alerts Get SEC Filing Alerts |
| DNB Stock Price Chart |
| Next Earnings Dates |
Next Earnings Date Calendar:Viatris (VTRS): 5/8/2023 6:00 AMSix Flags Entertainment (SIX): 5/8/2023 6:00 AM LL Flooring Holdings (LL): 5/8/2023 6:00 AM DISH Network (DISH): 5/8/2023 6:05 AM Freshpet (FRPT): 5/8/2023 6:30 AM KKR & Co (KKR): 5/8/2023 6:50 AM Energizer Hldgs (ENR): 5/8/2023 6:50 AM ANI Pharmaceuticals (ANIP): 5/8/2023 6:50 AM Tyson Foods (TSN): 5/8/2023 6:55 AM Treehouse Foods (THS): 5/8/2023 6:55 AM More from the Next Earnings Dates Calendar Earnings History:Biglari Holdings Inc. Class A Common Stock (BH-A): 5/5/2023 6:08 PMVolcon (VLCN): 5/5/2023 After close Biglari Holdings (BH): 5/5/2023 After close Broadway Financial (BYFC): 5/5/2023 After close Pardes Biosciences (PRDS): 5/5/2023 After close Ruth's Hospitality Group (RUTH): 5/5/2023 After close RGC Resources (RGCO): 5/5/2023 9:37 AM Investors Title (ITIC): 5/5/2023 8:29 AM Liberty Braves Group (BATRA): 5/5/2023 8:15 AM Newmark Group (NMRK): 5/5/2023 8:15 AM More from the Earnings History archive |
| Featured Articles |
| Earnings Peers |
| Dun & Bradstreet Hldgs (DNB) is categorized under the Industrials sector; to help you further research past earnings across stocks, below are some other companies in the same sector:
DOV Past Earnings DRVN Past Earnings DSGR Past Earnings DSKE Past Earnings DXPE Past Earnings DY Past Earnings EBAY Past Earnings EBF Past Earnings ECHO Past Earnings ECOL Past Earnings |
Recommended: IMKTA Price Target, International Business Machines RSI, DTRM Insider Buying.