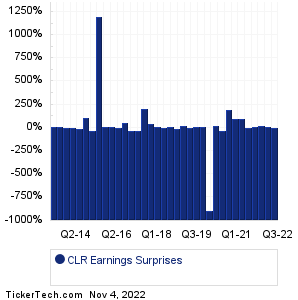
| Continental Resources Earnings Surprises | ||||||||||||||||||||||||||||||||||||||||||||||||||||||||||||||||||||||||||||||||||||||||||||||||||||||||||||||||||||||||||||||||||||||||||||||||
|
|
|
| Continental Resources Earnings Surprises | ||||||||||||||||||||||||||||||||||||||||||||||||||||||||||||||||||||||||||||||||||||||||||||||||||||||||||||||||||||||||||||||||||||||||||||||||
|
|
|
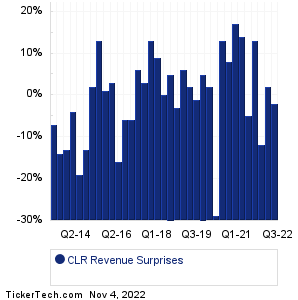
| CLR Revenue Surprises | ||||||||||||||||||||||||||||||||||||||||||||||||||||||||||||||||||||||||||||||||||||||||||||||||||||||||||||||||||||||||||||||||||||||||||||||||
|
| CLR Current Stock Quote |
Get Dividend Alerts Get SEC Filing Alerts |
| CLR Stock Price Chart |
| Next Earnings Dates |
Next Earnings Date Calendar:ACM Research (ACMR): 11/4/2022 5:00 AMInterface (TILE): 11/4/2022 5:30 AM Evergy (EVRG): 11/4/2022 6:00 AM Lamar Advertising (LAMR): 11/4/2022 6:00 AM Syneos Health (SYNH): 11/4/2022 6:00 AM Huntsman (HUN): 11/4/2022 6:00 AM PNM Resources (PNM): 11/4/2022 6:00 AM Gray Television (GTN): 11/4/2022 6:00 AM Proto Labs (PRLB): 11/4/2022 6:00 AM Paya Holdings (PAYA): 11/4/2022 6:00 AM More from the Next Earnings Dates Calendar Earnings History:Apartment Income REIT (AIRC): 11/3/2022 6:39 PMApollo Medical Holdings (AMEH): 11/3/2022 6:00 PM Cidara Therapeutics (CDTX): 11/3/2022 5:47 PM Artesian Resources (ARTNA): 11/3/2022 5:15 PM Resolute Forest Products (RFP): 11/3/2022 5:15 PM Tucows (TCX): 11/3/2022 5:05 PM AES (AES): 11/3/2022 5:00 PM Corteva (CTVA): 11/3/2022 5:00 PM Douglas Elliman (DOUG): 11/3/2022 After close Kimball International (KBAL): 11/3/2022 After close More from the Earnings History archive |
| Earnings Peers |
| Continental Resources (CLR) is categorized under the Energy sector; to help you further research past earnings across stocks, below are some other companies in the same sector:
CNX Historical Earnings COG Historical Earnings COP Historical Earnings CPE Historical Earnings CRC Historical Earnings CRK Historical Earnings CTOS Historical Earnings CTRA Historical Earnings CVI Historical Earnings CVX Historical Earnings |