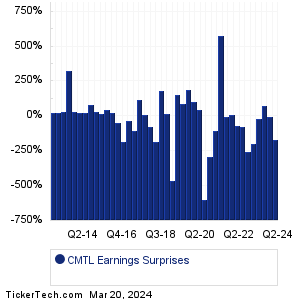
| Comtech Telecom Earnings Surprises | ||||||||||||||||||||||||||||||||||||||||||||||||||||||||||||||||||||||||||||||||||||||||||||||||||||||||||||||||||||||||||||||||||||||||||||||||||||||||||||||||||||
|
|
|
| Comtech Telecom Earnings Surprises | ||||||||||||||||||||||||||||||||||||||||||||||||||||||||||||||||||||||||||||||||||||||||||||||||||||||||||||||||||||||||||||||||||||||||||||||||||||||||||||||||||||
|
|
|
| CMTL Revenue Surprises | ||||||||||||||||||||||||||||||||||||||||||||||||||||||||||||||||||||||||||||||||||||||||||||||||||||||||||||||||||||||||||||||||||||||||||||||||||||||||||||||||||||
|
| CMTL Current Stock Quote |
Get Dividend Alerts Get SEC Filing Alerts |
| CMTL Stock Price Chart |
| Next Earnings Dates |
Next Earnings Date Calendar:Guaranty Bancshares (GNTY): 10/16/2023 7:00 AMCharles Schwab (SCHW): 10/16/2023 7:45 AM Servisfirst Bancshares (SFBS): 10/16/2023 After close CrossFirst Bankshares (CFB): 10/16/2023 After close FB Financial (FBK): 10/16/2023 After close Equity Lifestyle Props (ELS): 10/16/2023 After close Enerpac Tool Group (EPAC): 10/16/2023 After close Mercantile Bank (MBWM): 10/17/2023 5:01 AM Johnson & Johnson (JNJ): 10/17/2023 6:20 AM Bank of New York Mellon (BK): 10/17/2023 6:30 AM More from the Next Earnings Dates Calendar Earnings History:Vintage Wine Estates (VWE): 10/13/2023 After closeHingham Institution (HIFS): 10/13/2023 After close Progressive (PGR): 10/13/2023 8:21 AM Citigroup (C): 10/13/2023 8:00 AM PNC Finl Servs Gr (PNC): 10/13/2023 6:51 AM JPMorgan Chase (JPM): 10/13/2023 6:50 AM Wells Fargo (WFC): 10/13/2023 6:48 AM Biomerica (BMRA): 10/13/2023 6:39 AM BlackRock (BLK): 10/13/2023 6:15 AM Unity Bancorp (UNTY): 10/13/2023 6:00 AM More from the Earnings History archive |
| Earnings Peers |
| Comtech Telecom (CMTL) is categorized under the Technology sector; to help you further research past earnings across stocks, below are some other companies in the same sector:
CNSL Historical Earnings CNXC Historical Earnings CNXN Historical Earnings CODA Historical Earnings COHU Historical Earnings COIN Historical Earnings COMM Historical Earnings COMP Historical Earnings COUP Historical Earnings COUR Historical Earnings |
Recommended: Institutional Holders of RLJ, AVGR Videos, BCYC Videos.
Click the button below for your complimentary copy of Your Early Retirement Portfolio: Dividends Up to 8.1%—Every Month—Forever.
You'll discover the details on 4 stocks and funds that pay you massive dividends as high as 8.1%.