CMO Earnings Surprises image   This CMO earnings surprises page last updated 11/16/2021
CMO Earnings Surprises Chart
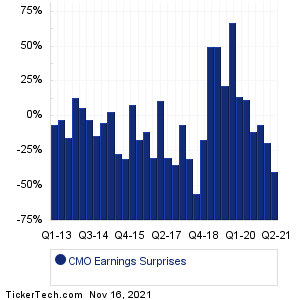
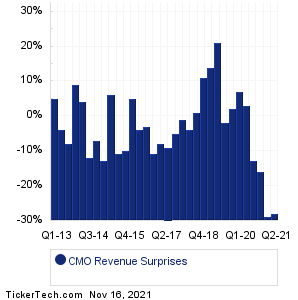
Data adjusted for CMO split history

PeriodExpectedActualSurprise
Q2 2021 0.15 0.09 -0.06 (-40%)
Q1 2021 0.16 0.13 -0.03 (-19%)
Q4 2020 0.16 0.15 -0.01 (-6%)
Q3 2020 0.18 0.16 -0.02 (-11%)
Q2 2020 0.16 0.18 +0.02 (+12%)
Q1 2020 0.14 0.16 +0.02 (+14%)
Q4 2019 0.09 0.15 +0.06 (+67%)
Q3 2019 0.09 0.11 +0.02 (+22%)
Q2 2019 0.08 0.12 +0.04 (+50%)
Q1 2019 0.08 0.12 +0.04 (+50%)
Q4 2018 0.06 0.05 -0.01 (-17%)
Q3 2018 0.09 0.04 -0.05 (-56%)
Q2 2018 0.13 0.09 -0.04 (-31%)
Q1 2018 0.17 0.16 -0.01 (-6%)
Q3 2017 0.20 0.13 -0.07 (-35%)
Q2 2017 0.20 0.14 -0.06 (-30%)
Q1 2017 0.18 0.20 +0.02 (+11%)
Q4 2016 0.20 0.14 -0.06 (-30%)
Q3 2016 0.18 0.16 -0.02 (-11%)
Q2 2016 0.23 0.19 -0.04 (-17%)
Q4 2015 0.24 0.26 +0.02 (+8%)
Q3 2015 0.26 0.18 -0.08 (-31%)
Q2 2015 0.30 0.22 -0.08 (-27%)
Q1 2015 0.31 0.32 +0.01 (+3%)
Q4 2014 0.33 0.31 -0.02 (-6%)
Q3 2014 0.35 0.30 -0.05 (-14%)
Q2 2014 0.36 0.35 -0.01 (-3%)
Q1 2014 0.35 0.37 +0.02 (+6%)
Q4 2013 0.31 0.35 +0.04 (+13%)
Q2 2013 0.32 0.27 -0.05 (-16%)
Q1 2013 0.32 0.31 -0.01 (-3%)
Q4 2012 0.33 0.31 -0.02 (-6%)
CMO Revenue Surprises Chart
PeriodExpectedActualSurprise
Q2 2021 28.76M 20.79M -7.97M (-28%)
Q1 2021 37.01M 26.18M -10.83M (-29%)
Q4 2020 37.23M 31.39M -5.84M (-16%)
Q3 2020 43.43M 37.61M -5.82M (-13%)
Q2 2020 46.71M 48.16M +1.45M (+3%)
Q1 2020 65.00M 69.63M +4.63M (+7%)
Q4 2019 73.00M 74.28M +1.28M (+2%)
Q3 2019 80.00M 78.76M -1.24M (-2%)
Q2 2019 71.00M 85.70M +14.70M (+21%)
Q1 2019 74.00M 84.23M +10.23M (+14%)
Q4 2018 66.00M 73.53M +7.53M (+11%)
Q3 2018 67.00M 68.00M +999000 (+1%)
Q2 2018 68.00M 65.51M -2.49M (-4%)
Q1 2018 70.00M 69.55M -0.45M (-1%)
Q3 2017 60.30M 57.44M -2.86M (-5%)
Q2 2017 62.10M 56.34M -5.76M (-9%)
Q1 2017 60.00M 54.99M -5.01M (-8%)
Q4 2016 56.15M 50.18M -5.97M (-11%)
Q3 2016 51.45M 50.02M -1.43M (-3%)
Q2 2016 55.80M 53.44M -2.36M (-4%)
Q4 2015 54.60M 57.58M +2.98M (+5%)
Q3 2015 55.00M 49.57M -5.43M (-10%)
Q2 2015 56.58M 50.44M -6.14M (-11%)
Q1 2015 55.51M 58.74M +3.23M (+6%)
Q4 2014 41.50M 36.22M -5.28M (-13%)
Q3 2014 57.75M 53.94M -3.81M (-7%)
Q2 2014 58.07M 51.17M -6.90M (-12%)
Q1 2014 57.45M 59.51M +2.06M (+4%)
Q4 2013 53.59M 58.51M +4.92M (+9%)
Q2 2013 55.90M 51.68M -4.22M (-8%)
Q1 2013 61.27M 58.58M -2.69M (-4%)
Q4 2012 58.04M 61.17M +3.13M (+5%)
Quotes delayed 20 minutes

Email EnvelopeFree CMO Email Alerts:
Get Dividend Alerts
Get SEC Filing Alerts
10 Most Oversold S&P 500 Stocks
10 Most Overbought S&P 500 Stocks
10 ETFs With Stocks Insiders Are Buying
10 ETFs With Most Upside To Targets
The DividendRank Top 25
Warren Buffett Dividend Stocks
10 Cheap Dividend Stocks Under $10
10 Top DividendRank'ed Energy Stocks
The 10 Highest Yielding Preferred Stocks
The 15 Most Active S&P Call & Put Options

Next Earnings Date Calendar:

Aramark (ARMK): 11/16/2021 6:30 AM
Home Depot (HD): 11/16/2021 7:00 AM
Walmart (WMT): 11/16/2021 7:00 AM
Evoqua Water Technologies (AQUA): 11/16/2021 7:00 AM
Applied UV (AUVI): 11/16/2021 7:00 AM
TransDigm Gr (TDG): 11/16/2021 8:00 AM
Griffon (GFF): 11/16/2021 8:00 AM
NRX Pharmaceuticals (NRXP): 11/16/2021 8:00 AM
Enveric Biosciences (ENVB): 11/16/2021 8:04 AM
PAVmed (PAVM): 11/16/2021 After close

More from the Next Earnings Dates Calendar

Earnings History:

Servotronics (SVT): 11/15/2021 5:00 PM
Petros Pharmaceuticals (PTPI): 11/15/2021 5:00 PM
Adial Pharmaceuticals (ADIL): 11/15/2021 5:00 PM
Rekor Systems (REKR): 11/15/2021 5:00 PM
RMR Group (RMR): 11/15/2021 5:00 PM
BioAtla (BCAB): 11/15/2021 5:00 PM
Compass Minerals Intl (CMP): 11/15/2021 5:00 PM
Xcel Brands (XELB): 11/15/2021 After close
KULR Tech Group (KULR): 11/15/2021 After close
Aveanna Healthcare Hldgs (AVAH): 11/15/2021 After close

More from the Earnings History archive
Capstead Mortgage (CMO) is categorized under the Financials sector; to help you further research past earnings across stocks, below are some other companies in the same sector:

CNNE Past Earnings
CNO Past Earnings
CNOB Past Earnings
CNS Past Earnings
COF Past Earnings
COFS Past Earnings
COLB Past Earnings
COLD Past Earnings
CONE Past Earnings
COOP Past Earnings
On this page we presented the CMO earnings surprises information for Capstead Mortgage, comparing the expected earnings versus the actual earnings quarter by quarter, with the resulting positive or negative percentage surprise. Any self directed investor doing their due diligence on CMO (or any other given stock) can benefit from researching all of the Capstead Mortgage past earnings going backwards in time, including how often the company beat or missed the market's expectations. To help you with this Capstead Mortgage earnings surprise research, on this page we presented each quarter's resulting numbers for easy comparison. Studying these numbers can help an investor by providing important context with which to think about CMO's next earnings report. In your continued research on Capstead Mortgage we hope you will be sure to check out the further links included for revenue and earnings history as well as next earnings dates for CMO. Thanks for visiting, and the next time you need to research CMO earnings surprises or those of another stock, we hope you'll think of our site as your go-to earnings surprises research resource of choice.
 

CMO Earnings Surprises | www.NextEarningsDate.com | Copyright © 2020 - 2021, All Rights Reserved

Nothing in NextEarningsDate.com is intended to be investment advice, nor does it represent the opinion of, counsel from, or recommendations by BNK Invest Inc. or any of its affiliates, subsidiaries or partners. None of the information contained herein constitutes a recommendation that any particular security, portfolio, transaction, or investment strategy is suitable for any specific person. All viewers agree that under no circumstances will BNK Invest, Inc,. its subsidiaries, partners, officers, employees, affiliates, or agents be held liable for any loss or damage caused by your reliance on information obtained. By visiting, using or viewing this site, you agree to the following Full Disclaimer & Terms of Use and Privacy Policy. Video widget and market videos powered by Market News Video. Quote and option data delayed at least 15 minutes; stock quote data powered by Ticker Technologies, and Mergent.