CIT Group Earnings Surprises image   This CIT earnings surprises page last updated 1/18/2022
CIT Group Earnings Surprises Chart
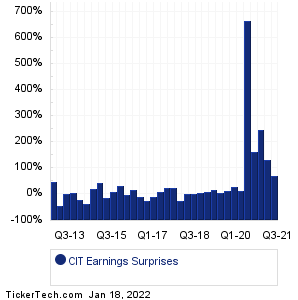
Data adjusted for CIT split history

PeriodExpectedActualSurprise
Q3 2021 1.08 1.84 +0.76 (+70%)
Q2 2021 0.90 2.09 +1.19 (+132%)
Q1 2021 0.71 2.47 +1.76 (+248%)
Q4 2020 0.57 1.50 +0.93 (+163%)
Q3 2020 0.11 0.84 +0.73 (+664%)
Q2 2020 -0.55 -0.62 -0.07 (+13%)
Q1 2020 0.74 0.95 +0.21 (+28%)
Q4 2019 1.13 1.27 +0.14 (+12%)
Q3 2019 1.23 1.29 +0.06 (+5%)
Q2 2019 1.13 1.32 +0.19 (+17%)
Q1 2019 1.08 1.18 +0.10 (+9%)
Q4 2018 1.15 1.21 +0.06 (+5%)
Q3 2018 1.12 1.15 +0.03 (+3%)
Q2 2018 0.98 1.00 +0.02 (+2%)
Q1 2018 0.97 0.74 -0.23 (-24%)
Q4 2017 0.80 0.99 +0.19 (+24%)
Q3 2017 0.81 1.02 +0.21 (+26%)
Q2 2017 0.61 0.68 +0.07 (+11%)
Q1 2017 0.59 0.54 -0.05 (-8%)
Q4 2016 0.78 0.59 -0.19 (-24%)
Q3 2016 0.79 0.73 -0.06 (-8%)
Q2 2016 0.77 0.90 +0.13 (+17%)
Q1 2016 0.76 0.75 -0.01 (-1%)
Q4 2015 0.83 1.10 +0.27 (+33%)
Q3 2015 0.72 0.78 +0.06 (+8%)
Q1 2015 0.73 0.62 -0.11 (-15%)
Q4 2014 0.95 1.37 +0.42 (+44%)
Q2 2014 0.85 1.02 +0.17 (+20%)
Q1 2014 0.88 0.55 -0.33 (-38%)
Q4 2013 0.82 0.65 -0.17 (-21%)
Q3 2013 0.94 0.99 +0.05 (+5%)
Q2 2013 0.90 0.92 +0.02 (+2%)
Q1 2013 1.42 0.81 -0.61 (-43%)
Q4 2012 0.70 1.03 +0.33 (+47%)
CIT Group Revenue Surprises Chart
PeriodExpectedActualSurprise
Q3 2021 447.50M 432.10M -15.40M (-3%)
Q2 2021 462.00M 477.60M +15.60M (+3%)
Q1 2021 464.00M 556.80M +92.80M (+20%)
Q4 2020 451.85M 496.10M +44.25M (+10%)
Q3 2020 442.56M 474.00M +31.44M (+7%)
Q2 2020 475.96M 410.70M -65.26M (-14%)
Q1 2020 551.17M 496.40M -54.77M (-10%)
Q4 2019 449.31M 461.10M +11.79M (+3%)
Q3 2019 460.86M 454.30M -6.56M (-1%)
Q2 2019 460.77M 467.00M +6.23M (+1%)
Q1 2019 462.51M 466.00M +3.49M (+1%)
Q4 2018 482.77M 421.40M -61.37M (-13%)
Q3 2018 471.74M 475.60M +3.86M (+1%)
Q2 2018 479.03M 524.40M +45.37M (+9%)
Q1 2018 472.32M 495.20M +22.88M (+5%)
Q4 2017 472.78M 536.60M +63.82M (+13%)
Q3 2017 490.13M 463.90M -26.23M (-5%)
Q2 2017 494.88M 474.10M -20.78M (-4%)
Q1 2017 505.13M 495.70M -9.43M (-2%)
Q4 2016 614.34M 590.70M -23.64M (-4%)
Q3 2016 622.98M 608.70M -14.28M (-2%)
Q2 2016 620.33M 645.10M +24.77M (+4%)
Q1 2016 618.75M 653.80M +35.05M (+6%)
Q4 2015 600.64M 558.60M -42.04M (-7%)
Q3 2015 521.05M 520.90M -0.15M (-0%)
Q1 2015 456.74M 423.80M -32.94M (-7%)
Q4 2014 451.20M 489.30M +38.10M (+8%)
Q2 2014 437.04M 454.60M +17.56M (+4%)
Q1 2014 445.31M 324.00M -0.12B (-27%)
Q4 2013 57.48M 888.80M +831.32M (+1446%)
Q3 2013 75.05M 462.30M +387.25M (+516%)
Q2 2013 82.47M 460.60M +378.13M (+459%)
Q1 2013 67.86M 163.00M +95.14M (+140%)
Q4 2012 400.00M 614.10M +214.10M (+54%)
Quotes delayed 20 minutes

Email EnvelopeFree CIT Email Alerts:
Get Dividend Alerts
Get SEC Filing Alerts
10 Most Oversold S&P 500 Stocks
10 Most Overbought S&P 500 Stocks
10 ETFs With Stocks Insiders Are Buying
10 ETFs With Most Upside To Targets
The DividendRank Top 25
Warren Buffett Dividend Stocks
10 Cheap Dividend Stocks Under $10
10 Top DividendRank'ed Energy Stocks
The 10 Highest Yielding Preferred Stocks
The 15 Most Active S&P Call & Put Options

Next Earnings Date Calendar:

Signature Bank (SBNY): 1/18/2022 5:00 AM
Mercantile Bank (MBWM): 1/18/2022 5:01 AM
Truist Financial (TFC): 1/18/2022 5:45 AM
Silvergate Capital (SI): 1/18/2022 6:25 AM
Bank of New York Mellon (BK): 1/18/2022 6:30 AM
PNC Financial Services Gr (PNC): 1/18/2022 6:45 AM
Guaranty Bancshares (GNTY): 1/18/2022 7:00 AM
Goldman Sachs Group (GS): 1/18/2022 7:30 AM
Old National Bancorp (ONB): 1/18/2022 8:00 AM
First Midwest Bancorp (FMBI): 1/18/2022 8:00 AM

More from the Next Earnings Dates Calendar

Earnings History:

Schmitt Industries (SMIT): 1/14/2022 5:00 PM
Flanigan's Enterprises (BDL): 1/14/2022 After close
Citigroup (C): 1/14/2022 8:00 AM
First Republic Bank (FRC): 1/14/2022 7:00 AM
Wells Fargo (WFC): 1/14/2022 6:48 AM
JPMorgan Chase (JPM): 1/14/2022 6:47 AM
BlackRock (BLK): 1/14/2022 6:30 AM
NextPlay Technologies (NXTP): 1/13/2022 5:20 PM
Washington Federal (WAFD): 1/13/2022 5:00 PM
Rocky Mountain Chocolate (RMCF): 1/13/2022 7:15 AM

More from the Earnings History archive
CIT Group (CIT) is categorized under the Financials sector; to help you further research past earnings across stocks, below are some other companies in the same sector:

CIVB Past Earnings
CIZN Past Earnings
CLBK Past Earnings
CLDB Past Earnings
CLDT Past Earnings
CLI Past Earnings
CLNC Past Earnings
CLNY Past Earnings
CLPR Past Earnings
CMA Past Earnings
On this page we presented the CIT earnings surprises information for CIT Group, comparing the expected earnings versus the actual earnings quarter by quarter, with the resulting positive or negative percentage surprise. Any self directed investor doing their due diligence on CIT (or any other given stock) can benefit from researching all of the CIT Group past earnings going backwards in time, including how often the company beat or missed the market's expectations. To help you with this CIT Group earnings surprise research, on this page we presented each quarter's resulting numbers for easy comparison. Studying these numbers can help an investor by providing important context with which to think about CIT's next earnings report. In your continued research on CIT Group we hope you will be sure to check out the further links included for revenue and earnings history as well as next earnings dates for CIT. Thanks for visiting, and the next time you need to research CIT earnings surprises or those of another stock, we hope you'll think of our site as your go-to earnings surprises research resource of choice.

Recommended: Funds Holding AMCC, Top Ten Hedge Funds Holding SWAV, Institutional Holders of REFA.


CIT Group Earnings Surprises | www.NextEarningsDate.com | Copyright © 2020 - 2022, All Rights Reserved

Nothing in NextEarningsDate.com is intended to be investment advice, nor does it represent the opinion of, counsel from, or recommendations by BNK Invest Inc. or any of its affiliates, subsidiaries or partners. None of the information contained herein constitutes a recommendation that any particular security, portfolio, transaction, or investment strategy is suitable for any specific person. All viewers agree that under no circumstances will BNK Invest, Inc,. its subsidiaries, partners, officers, employees, affiliates, or agents be held liable for any loss or damage caused by your reliance on information obtained. By visiting, using or viewing this site, you agree to the following Full Disclaimer & Terms of Use and Privacy Policy. Video widget and market videos powered by Market News Video. Quote and option data delayed at least 15 minutes; stock quote data powered by Ticker Technologies, and Mergent.