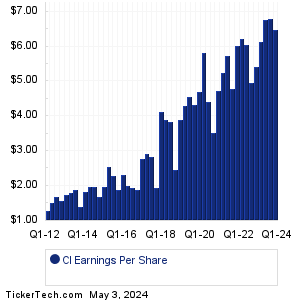
| Cigna Group Earnings History | |||||||||||||||||||||||||||||||||||||||||||||||||||||||||||||||||||||||||||||||||||||||||||||||||||||||||||||||||||||||||||||||||||||||||||||
|
|
|
| Cigna Group Earnings History | |||||||||||||||||||||||||||||||||||||||||||||||||||||||||||||||||||||||||||||||||||||||||||||||||||||||||||||||||||||||||||||||||||||||||||||
|
|
|
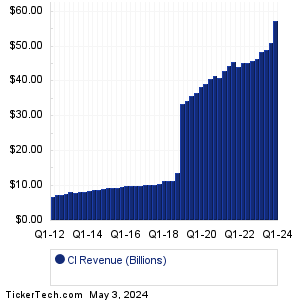
| CI Revenue History | |||||||||||||||||||||||||||||||||||||||||||||||||||||||||||||||||||||||||||||||||||||||||||||||||||||||||||||||||||||||||||||||||||||||||||||
|
| CI Current Stock Quote |
Get Dividend Alerts Get SEC Filing Alerts |
| CI Stock Price Chart |
| Next Earnings Dates |
Next Earnings Date Calendar:Viatris (VTRS): 8/7/2023 6:00 AMHawaiian Electric Indus (HE): 8/7/2023 6:00 AM TCR2 Therapeutics (TCRR): 8/7/2023 6:00 AM Henry Schein (HSIC): 8/7/2023 6:30 AM Elanco Animal Health (ELAN): 8/7/2023 6:30 AM Freshpet (FRPT): 8/7/2023 6:30 AM Graham (GHM): 8/7/2023 6:30 AM AG Mortgage Investment (MITT): 8/7/2023 6:30 AM KKR & Co (KKR): 8/7/2023 6:50 AM Tyson Foods (TSN): 8/7/2023 6:55 AM More from the Next Earnings Dates Calendar Earnings History:Adtran (ADTN): 8/6/2023 6:46 PMBerkshire Hathaway Inc. Common Stock (BRK-A): 8/5/2023 8:00 AM Berkshire Hathaway Inc. New Common Stock (BRK-B): 8/5/2023 8:00 AM Tennant (TNC): 8/4/2023 9:00 AM DigitalBridge Gr (DBRG): 8/4/2023 8:30 AM Liberty Braves Group (BATRA): 8/4/2023 8:15 AM Liberty Braves Group (BATRK): 8/4/2023 8:15 AM Liberty Broadband (LBRDA): 8/4/2023 8:15 AM Liberty SiriusXM Gr (LSXMA): 8/4/2023 8:15 AM Liberty Formula One Group (FWONA): 8/4/2023 8:15 AM More from the Earnings History archive |
| Featured Articles |
| Earnings Peers |
| Cigna Group (CI) is categorized under the Healthcare sector; to help you further research past earnings across stocks, below are some other companies in the same sector:
CINC Past Earnings CKPT Past Earnings CLBS Past Earnings CLDX Past Earnings CLNN Past Earnings CLOV Past Earnings CLPT Past Earnings CLRB Past Earnings CLSD Past Earnings CLSN Past Earnings |
Recommended: Funds Holding IWFG, Top Ten Hedge Funds Holding PQSG, Funds Holding POZN.
Click the button below for your complimentary copy of Your Early Retirement Portfolio: Dividends Up to 7.8%—Every Month—Forever.
You'll discover the details on 4 stocks and funds that pay you massive dividends as high as 7.8%.