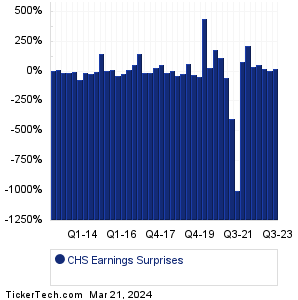
| CHS Earnings Surprises | ||||||||||||||||||||||||||||||||||||||||||||||||||||||||||||||||||||||||||||||||||||||||||||||||||||||||||||||||||||||||||||||||||||||||||||||||||||||||||||||||||||||||||||
|
|
|
| CHS Earnings Surprises | ||||||||||||||||||||||||||||||||||||||||||||||||||||||||||||||||||||||||||||||||||||||||||||||||||||||||||||||||||||||||||||||||||||||||||||||||||||||||||||||||||||||||||||
|
|
|
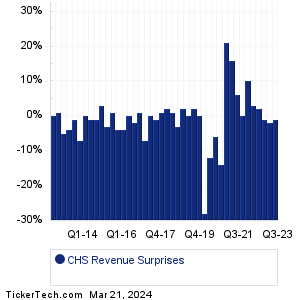
| CHS Revenue Surprises | ||||||||||||||||||||||||||||||||||||||||||||||||||||||||||||||||||||||||||||||||||||||||||||||||||||||||||||||||||||||||||||||||||||||||||||||||||||||||||||||||||||||||||||
|
| CHS Current Stock Quote |
Get Dividend Alerts Get SEC Filing Alerts |
| CHS Stock Price Chart |
| Next Earnings Dates |
Next Earnings Date Calendar:Rockwell Medical (RMTI): 3/21/2024 6:00 AMFennec Pharmaceuticals (FENC): 3/21/2024 6:01 AM X4 Pharmaceuticals (XFOR): 3/21/2024 6:05 AM Shoe Carnival (SCVL): 3/21/2024 6:15 AM Accenture (ACN): 3/21/2024 6:45 AM Commercial Metals (CMC): 3/21/2024 6:45 AM Titan Machinery (TITN): 3/21/2024 6:45 AM Designer Brands (DBI): 3/21/2024 6:45 AM Darden Restaurants (DRI): 3/21/2024 7:00 AM FactSet Research Systems (FDS): 3/21/2024 7:00 AM More from the Next Earnings Dates Calendar Earnings History:Nortech Systems (NSYS): 3/20/2024 After closeEnerpac Tool Group (EPAC): 3/20/2024 After close Worthington Industries (WOR): 3/20/2024 After close Sadot Group (SDOT): 3/20/2024 After close Hall Of Fame Resort (HOFV): 3/20/2024 After close Chewy (CHWY): 3/20/2024 After close Guess (GES): 3/20/2024 After close CuriosityStream (CURI): 3/20/2024 After close Envela (ELA): 3/20/2024 After close KB Home (KBH): 3/20/2024 After close More from the Earnings History archive |
| Earnings Peers |
| Chico's FAS (CHS) is categorized under the Services sector; to help you further research past earnings across stocks, below are some other companies in the same sector:
CHTR Historical Earnings CHUY Historical Earnings CIDM Historical Earnings CMG Historical Earnings CMLS Historical Earnings CNK Historical Earnings CNTY Historical Earnings CNVS Historical Earnings CONN Historical Earnings CORE Historical Earnings |
Recommended: ETFs Holding SBGL, Funds Holding POWR, Funds Holding DAVE.
Click the button below for your complimentary copy of Your Early Retirement Portfolio: Dividends Up to 9.5%—Every Month—Forever.
You'll discover the details on 4 stocks and funds that pay you massive dividends as high as 9.5%.