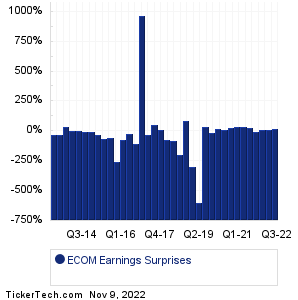
| ChannelAdvisor Earnings Surprises | ||||||||||||||||||||||||||||||||||||||||||||||||||||||||||||||||||||||||||||||||||||||||||||||||||||||||||||||||||||||||||||||||||||||||||||||||||||
|
|
|
| ChannelAdvisor Earnings Surprises | ||||||||||||||||||||||||||||||||||||||||||||||||||||||||||||||||||||||||||||||||||||||||||||||||||||||||||||||||||||||||||||||||||||||||||||||||||||
|
|
|
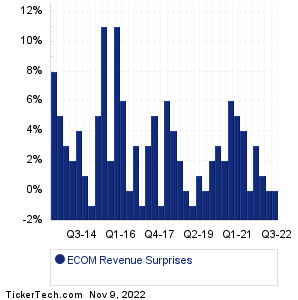
| ECOM Revenue Surprises | ||||||||||||||||||||||||||||||||||||||||||||||||||||||||||||||||||||||||||||||||||||||||||||||||||||||||||||||||||||||||||||||||||||||||||||||||||||
|
| ECOM Current Stock Quote |
Get Dividend Alerts Get SEC Filing Alerts |
| ECOM Stock Price Chart |
| Next Earnings Dates |
Next Earnings Date Calendar:Hecla Mining (HL): 11/9/2022 3:30 AMCoherent (COHR): 11/9/2022 6:00 AM Walker & Dunlop (WD): 11/9/2022 6:00 AM Hanesbrands (HBI): 11/9/2022 6:00 AM RadNet (RDNT): 11/9/2022 6:00 AM D.R. Horton (DHI): 11/9/2022 6:30 AM SeaWorld Entertainment (SEAS): 11/9/2022 6:30 AM Wolverine World Wide (WWW): 11/9/2022 6:30 AM International Money (IMXI): 11/9/2022 6:30 AM FTC Solar (FTCI): 11/9/2022 6:30 AM More from the Next Earnings Dates Calendar Earnings History:Team (TISI): 11/8/2022 6:49 PMFlotek Industries (FTK): 11/8/2022 5:30 PM Ovintiv (OVV): 11/8/2022 5:30 PM Ziff Davis (ZD): 11/8/2022 5:22 PM NextPlay Technologies (NXTP): 11/8/2022 5:00 PM Lument Finance Trust (LFT): 11/8/2022 5:00 PM Forum Energy Technologies (FET): 11/8/2022 5:00 PM Phathom Pharmaceuticals (PHAT): 11/8/2022 5:00 PM Hyliion Holdings (HYLN): 11/8/2022 5:00 PM Lemonade (LMND): 11/8/2022 5:00 PM More from the Earnings History archive |
| Earnings Peers |
| ChannelAdvisor (ECOM) is categorized under the Technology sector; to help you further research past earnings across stocks, below are some other companies in the same sector:
EGAN Historical Earnings EGHT Historical Earnings EGIO Historical Earnings EMKR Historical Earnings ENPH Historical Earnings ENTG Historical Earnings ENV Historical Earnings EPAM Historical Earnings EPAY Historical Earnings EQIX Historical Earnings |
Recommended: HUBB Insider Buying, XLK Historical Stock Prices, Funds Holding BSE.