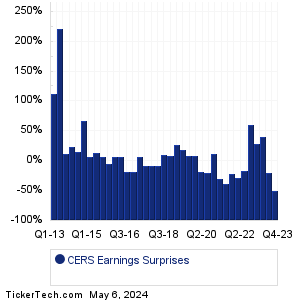
| CERS Earnings Surprises | ||||||||||||||||||||||||||||||||||||||||||||||||||||||||||||||||||||||||||||||||||||||||||||||||||||||||||||||||||||||||||||||||||||||||||||||||||||||||
|
|
|
| CERS Earnings Surprises | ||||||||||||||||||||||||||||||||||||||||||||||||||||||||||||||||||||||||||||||||||||||||||||||||||||||||||||||||||||||||||||||||||||||||||||||||||||||||
|
|
|
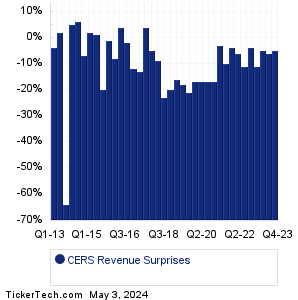
| CERS Revenue Surprises | ||||||||||||||||||||||||||||||||||||||||||||||||||||||||||||||||||||||||||||||||||||||||||||||||||||||||||||||||||||||||||||||||||||||||||||||||||||||||
|
| CERS Current Stock Quote |
Get Dividend Alerts Get SEC Filing Alerts |
| CERS Stock Price Chart |
| Next Earnings Dates |
Next Earnings Date Calendar:Regions Finl (RF): 4/19/2024 6:00 AMSRM Entertainment (SRM): 4/19/2024 6:11 AM Fifth Third Bancorp (FITB): 4/19/2024 6:30 AM Huntington Bancshares (HBAN): 4/19/2024 6:30 AM Procter & Gamble (PG): 4/19/2024 6:55 AM American Express (AXP): 4/19/2024 7:00 AM SLB (SLB): 4/19/2024 7:00 AM Alaunos Therapeutics (TCRT): 4/19/2024 7:00 AM Lakeland Bancorp (LBAI): 4/19/2024 8:00 AM Tootsie Roll Industries (TR): 4/19/2024 9:00 AM More from the Next Earnings Dates Calendar Earnings History:BancFirst (BANF): 4/18/2024 5:30 PMProvident Finl Servs (PFS): 4/18/2024 5:00 PM Glacier Bancorp (GBCI): 4/18/2024 After close Hilltop Hldgs (HTH): 4/18/2024 After close First Western Financial (MYFW): 4/18/2024 After close BayCom (BCML): 4/18/2024 After close OceanFirst Financial (OCFC): 4/18/2024 After close Independent Bank (INDB): 4/18/2024 After close Chemung Financial (CHMG): 4/18/2024 After close Southern First Bancshares (SFST): 4/18/2024 After close More from the Earnings History archive |
| Earnings Peers |
| Cerus (CERS) is categorized under the Healthcare sector; to help you further research past earnings across stocks, below are some other companies in the same sector:
CFMS Historical Earnings CFRX Historical Earnings CGEM Historical Earnings CGTX Historical Earnings CHE Historical Earnings CHMA Historical Earnings CHRS Historical Earnings CI Historical Earnings CINC Historical Earnings CKPT Historical Earnings |
Recommended: DDR market cap history, PHIN Average Annual Return, PSB Stock Predictions.
Click the button below for your complimentary copy of Your Early Retirement Portfolio: Dividends Up to 8.7%—Every Month—Forever.
You'll discover the details on 4 stocks and funds that pay you massive dividends as high as 8.7%.