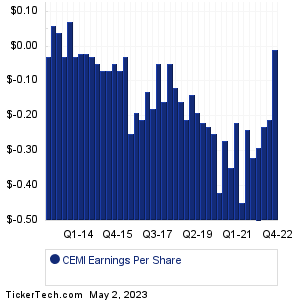
| CEMI Earnings History | |||||||||||||||||||||||||||||||||||||||||||||||||||||||||||||||||||||||||||||||||||||||||||||||||||||||||||||||||||||||||||||||||
|
|
|
| CEMI Earnings History | |||||||||||||||||||||||||||||||||||||||||||||||||||||||||||||||||||||||||||||||||||||||||||||||||||||||||||||||||||||||||||||||||
|
|
|
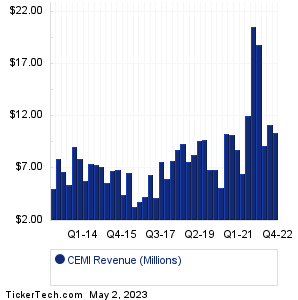
| CEMI Revenue History | |||||||||||||||||||||||||||||||||||||||||||||||||||||||||||||||||||||||||||||||||||||||||||||||||||||||||||||||||||||||||||||||||
|
| CEMI Current Stock Quote |
Get Dividend Alerts Get SEC Filing Alerts |
| CEMI Stock Price Chart |
| Next Earnings Dates |
Next Earnings Date Calendar:Pasithea Therapeutics (KTTA): 5/2/2023 4:00 AMDuPont de Nemours (DD): 5/2/2023 6:00 AM Gartner (IT): 5/2/2023 6:00 AM Leidos Holdings (LDOS): 5/2/2023 6:00 AM M.D.C. Holdings (MDC): 5/2/2023 6:00 AM Pediatrix Medical Group (MD): 5/2/2023 6:00 AM Ares Comml Real Est (ACRE): 5/2/2023 6:00 AM Nautilus Biotechnology (NAUT): 5/2/2023 6:05 AM Eaton Corp (ETN): 5/2/2023 6:30 AM IDEXX Laboratories (IDXX): 5/2/2023 6:30 AM More from the Next Earnings Dates Calendar Earnings History:CVR Energy (CVI): 5/1/2023 7:09 PMOtter Tail (OTTR): 5/1/2023 6:00 PM VSE (VSEC): 5/1/2023 5:30 PM Sonoco Prods (SON): 5/1/2023 5:30 PM Solaris Oilfield Infra (SOI): 5/1/2023 5:21 PM Tetra Technologies (TTI): 5/1/2023 5:00 PM Douglas Dynamics (PLOW): 5/1/2023 5:00 PM Ryerson Holding (RYI): 5/1/2023 After close MSA Safety (MSA): 5/1/2023 After close Forward Air (FWRD): 5/1/2023 After close More from the Earnings History archive |
| Featured Articles |
| Earnings Peers |
| Chembio Diagnostics (CEMI) is categorized under the Healthcare sector; to help you further research past earnings across stocks, below are some other companies in the same sector:
CERC Past Earnings CERE Past Earnings CERS Past Earnings CFMS Past Earnings CFRX Past Earnings CGEM Past Earnings CGTX Past Earnings CHE Past Earnings CHMA Past Earnings CHRS Past Earnings |