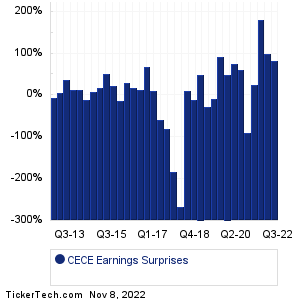
| CECE Earnings Surprises | ||||||||||||||||||||||||||||||||||||||||||||||||||||||||||||||||||||||||||||||||||||||||||||||||||||||||||||||||||||||||||||||||||||||||||||
|
|
|
| CECE Earnings Surprises | ||||||||||||||||||||||||||||||||||||||||||||||||||||||||||||||||||||||||||||||||||||||||||||||||||||||||||||||||||||||||||||||||||||||||||||
|
|
|
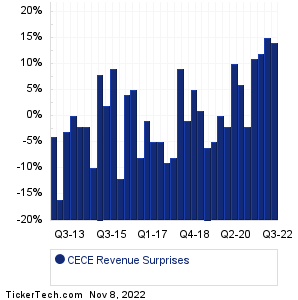
| CECE Revenue Surprises | ||||||||||||||||||||||||||||||||||||||||||||||||||||||||||||||||||||||||||||||||||||||||||||||||||||||||||||||||||||||||||||||||||||||||||||
|
| CECE Current Stock Quote |
Get Dividend Alerts Get SEC Filing Alerts |
| CECE Stock Price Chart |
| Next Earnings Dates |
Next Earnings Date Calendar:DuPont de Nemours (DD): 11/8/2022 6:00 AMNew Fortress Energy (NFE): 11/8/2022 6:00 AM Northwest Natural Holding (NWN): 11/8/2022 6:00 AM Squarespace (SQSP): 11/8/2022 6:00 AM MannKind (MNKD): 11/8/2022 6:00 AM Armada Hoffler Properties (AHH): 11/8/2022 6:00 AM First Advantage (FA): 11/8/2022 6:00 AM Triumph Group (TGI): 11/8/2022 6:00 AM Vertex Energy (VTNR): 11/8/2022 6:00 AM InfuSystems Holdings (INFU): 11/8/2022 6:00 AM More from the Next Earnings Dates Calendar Earnings History:Adtran (ADTN): 11/7/2022 8:05 PMMosaic (MOS): 11/7/2022 5:30 PM Manitowoc Co (MTW): 11/7/2022 5:00 PM Lordstown Motors (RIDE): 11/7/2022 5:00 PM Vishay Precision Group (VPG): 11/7/2022 5:00 PM Riot Blockchain (RIOT): 11/7/2022 5:00 PM Mueller Water Products (MWA): 11/7/2022 5:00 PM Ashland Global Holdings (ASH): 11/7/2022 5:00 PM HCW Biologics (HCWB): 11/7/2022 After close DocGo (DCGO): 11/7/2022 After close More from the Earnings History archive |
| Earnings Peers |
| CECO Environmental (CECE) is categorized under the Industrials sector; to help you further research past earnings across stocks, below are some other companies in the same sector:
CFX Historical Earnings CGRN Historical Earnings CHPT Historical Earnings CHRA Historical Earnings CHRW Historical Earnings CHWY Historical Earnings CIR Historical Earnings CLGX Historical Earnings CLH Historical Earnings CMCO Historical Earnings |
Recommended: SBRAP Historical Stock Prices, NKX Videos, Top Ten Hedge Funds Holding MOH.