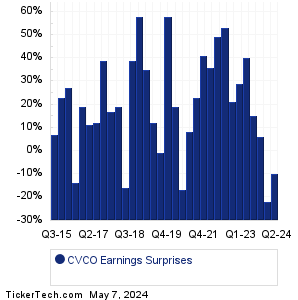
| Cavco Indus Earnings Surprises | ||||||||||||||||||||||||||||||||||||||||||||||||||||||||||||||||||||||||||||||||||||||||||||||||||||||||||||||||||||||||||||||||||||
|
|
|
| Cavco Indus Earnings Surprises | ||||||||||||||||||||||||||||||||||||||||||||||||||||||||||||||||||||||||||||||||||||||||||||||||||||||||||||||||||||||||||||||||||||
|
|
|
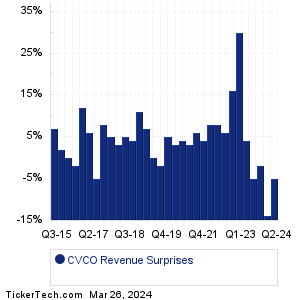
| CVCO Revenue Surprises | ||||||||||||||||||||||||||||||||||||||||||||||||||||||||||||||||||||||||||||||||||||||||||||||||||||||||||||||||||||||||||||||||||||
|
| CVCO Current Stock Quote |
Get Dividend Alerts Get SEC Filing Alerts |
| CVCO Stock Price Chart |
| Next Earnings Dates |
Next Earnings Date Calendar:McCormick & Co (MKC): 3/26/2024 6:30 AMMovado Group (MOV): 3/26/2024 6:45 AM Carrols Restaurant Group (TAST): 3/26/2024 7:00 AM bluebird bio (BLUE): 3/26/2024 7:00 AM Acumen Pharmaceuticals (ABOS): 3/26/2024 7:00 AM Sensei Biotherapeutics (SNSE): 3/26/2024 7:00 AM Delcath Systems (DCTH): 3/26/2024 7:30 AM Cognition Therapeutics (CGTX): 3/26/2024 7:30 AM Leonardo DRS (DRS): 3/26/2024 8:00 AM Hurco Cos (HURC): 3/26/2024 8:00 AM More from the Next Earnings Dates Calendar Earnings History:Lucid Diagnostics (LUCD): 3/25/2024 5:30 PMGranite Ridge Resources (GRNT): 3/25/2024 5:00 PM Excelerate Energy (EE): 3/25/2024 5:00 PM M-Tron Industries (MPTI): 3/25/2024 After close BuzzFeed (BZFD): 3/25/2024 After close Ampco-Pittsburgh (AP): 3/25/2024 After close Finch Therapeutics Gr (FNCH): 3/25/2024 After close Sutro Biopharma (STRO): 3/25/2024 After close Bakkt Hldgs (BKKT): 3/25/2024 After close Aerovate Therapeutics (AVTE): 3/25/2024 After close More from the Earnings History archive |
| Earnings Peers |
| Cavco Indus (CVCO) is categorized under the Services sector; to help you further research past earnings across stocks, below are some other companies in the same sector:
CVET Historical Earnings CVNA Historical Earnings CWH Historical Earnings CZR Historical Earnings DALN Historical Earnings DASH Historical Earnings DBGI Historical Earnings DBI Historical Earnings DDS Historical Earnings DENN Historical Earnings |
Recommended: CEF YTD Return, Top Ten Hedge Funds Holding ENTX, HPK Dividend Growth Rate.
Click the button below for your complimentary copy of Your Early Retirement Portfolio: Dividends Up to 9.5%—Every Month—Forever.
You'll discover the details on 4 stocks and funds that pay you massive dividends as high as 9.5%.