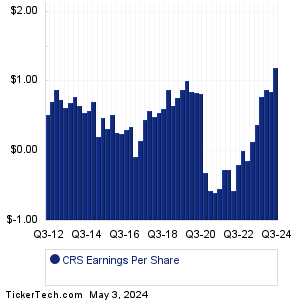
| Carpenter Tech Earnings History | ||||||||||||||||||||||||||||||||||||||||||||||||||||||||||||||||||||||||||||||||||||||||||||||||||||||||||||||||||||||||||||||||||||||||||||||||
|
|
|
| Carpenter Tech Earnings History | ||||||||||||||||||||||||||||||||||||||||||||||||||||||||||||||||||||||||||||||||||||||||||||||||||||||||||||||||||||||||||||||||||||||||||||||||
|
|
|
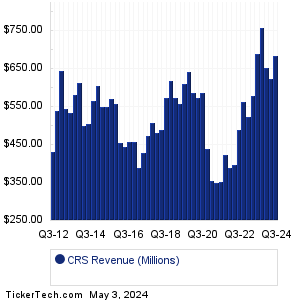
| CRS Revenue History | ||||||||||||||||||||||||||||||||||||||||||||||||||||||||||||||||||||||||||||||||||||||||||||||||||||||||||||||||||||||||||||||||||||||||||||||||
|
| CRS Current Stock Quote |
Get Dividend Alerts Get SEC Filing Alerts |
| CRS Stock Price Chart |
| Next Earnings Dates |
Next Earnings Date Calendar:Loews (L): 7/31/2023 6:00 AMImmunogen (IMGN): 7/31/2023 6:30 AM Community Bank System (CBU): 7/31/2023 6:45 AM SoFi Techs (SOFI): 7/31/2023 7:00 AM Symbotic (SYM): 7/31/2023 7:00 AM SJW Gr (SJW): 7/31/2023 7:30 AM ON Semiconductor (ON): 7/31/2023 8:00 AM Apellis Pharmaceuticals (APLS): 7/31/2023 8:00 AM Alexander's (ALX): 7/31/2023 8:00 AM SBA Comms (SBAC): 7/31/2023 After close More from the Next Earnings Dates Calendar Earnings History:5E Advanced Materials (FEAM): 7/29/2023 4:08 AMTerritorial Bancorp (TBNK): 7/28/2023 After close Ponce Finl Gr (PDLB): 7/28/2023 After close Middlesex Water (MSEX): 7/28/2023 After close FNCB Bancorp (FNCB): 7/28/2023 After close HomeStreet (HMST): 7/28/2023 After close Bogota Finl (BSBK): 7/28/2023 9:10 AM Meridian (MRBK): 7/28/2023 9:00 AM Red River Bancshares (RRBI): 7/28/2023 8:30 AM Civista Bancshares (CIVB): 7/28/2023 8:30 AM More from the Earnings History archive |
| Featured Articles |
| Earnings Peers |
| Carpenter Tech (CRS) is categorized under the Materials sector; to help you further research past earnings across stocks, below are some other companies in the same sector:
CSL Past Earnings CSTM Past Earnings CSWI Past Earnings CTIB Past Earnings CTVA Past Earnings DD Past Earnings DNA Past Earnings DNMR Past Earnings DOW Past Earnings DOX Past Earnings |
Click the button below for your complimentary copy of Your Early Retirement Portfolio: Dividends Up to 7.8%—Every Month—Forever.
You'll discover the details on 4 stocks and funds that pay you massive dividends as high as 7.8%.