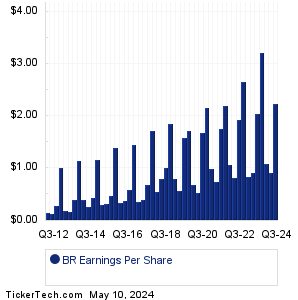
| Broadridge Financial Soln Earnings History | |||||||||||||||||||||||||||||||||||||||||||||||||||||||||||||||||||||||||||||||||||||||||||||||||||||||||||||||||||||||||||||||||||||||||||||||||||||||||
|
|
|
| Broadridge Financial Soln Earnings History | |||||||||||||||||||||||||||||||||||||||||||||||||||||||||||||||||||||||||||||||||||||||||||||||||||||||||||||||||||||||||||||||||||||||||||||||||||||||||
|
|
|
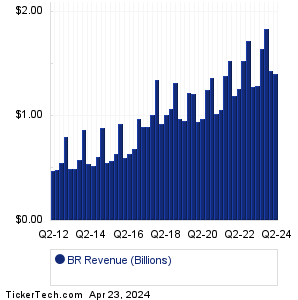
| BR Revenue History | |||||||||||||||||||||||||||||||||||||||||||||||||||||||||||||||||||||||||||||||||||||||||||||||||||||||||||||||||||||||||||||||||||||||||||||||||||||||||
|
| BR Current Stock Quote |
Get Dividend Alerts Get SEC Filing Alerts |
| BR Stock Price Chart |
| Next Earnings Dates |
Next Earnings Date Calendar:Genesco (GCO): 3/8/2024 6:50 AMDixie Gr (DXYN): 3/8/2024 7:00 AM America's Car-Mart (CRMT): 3/8/2024 8:00 AM Cue Biopharma (CUE): 3/9/2024 After close Fortrea Holdings (FTRE): 3/11/2024 7:00 AM Overseas Shipholding Gr (OSG): 3/11/2024 7:30 AM Genie Energy (GNE): 3/11/2024 7:30 AM Curis (CRIS): 3/11/2024 8:00 AM Ocular Therapeutix (OCUL): 3/11/2024 After close Ranpak Hldgs (PACK): 3/11/2024 After close More from the Next Earnings Dates Calendar Earnings History:Nine Energy Service (NINE): 3/7/2024 5:00 PMRing Energy (REI): 3/7/2024 After close Team (TISI): 3/7/2024 After close Markforged Holding (MKFG): 3/7/2024 After close NCS Multistage Holdings (NCSM): 3/7/2024 After close Quanex Building Prods (NX): 3/7/2024 After close National Beverage (FIZZ): 3/7/2024 After close Gap (GPS): 3/7/2024 After close Cherry Hill Mortgage (CHMI): 3/7/2024 After close Velocity Financial (VEL): 3/7/2024 After close More from the Earnings History archive |
| Featured Articles |
| Earnings Peers |
| Broadridge Financial Soln (BR) is categorized under the Financials sector; to help you further research past earnings across stocks, below are some other companies in the same sector:
BRDG Past Earnings BRKL Past Earnings BRMK Past Earnings BRO Past Earnings BRP Past Earnings BRSP Past Earnings BRT Past Earnings BRX Past Earnings BSBK Past Earnings BSIG Past Earnings |
Recommended: TEKK shares outstanding history, Funds Holding HEGE, MHI Insider Buying.
Click the button below for your complimentary copy of Your Early Retirement Portfolio: Dividends Up to 9.5%—Every Month—Forever.
You'll discover the details on 4 stocks and funds that pay you massive dividends as high as 9.5%.