| BOOM Earnings Surprises | ||||||||||||||||||||||||||||||||||||||||||||||||||||||||||||||||||||||||||||||||||||||||||||||||||||||||||||||||||||||||||||||||||||||||||||||||||||||||||||||||||||||||||||
|
|
|
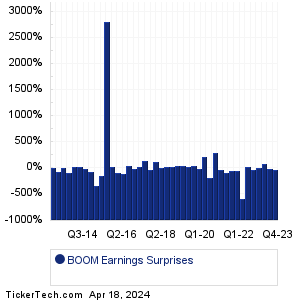
| BOOM Earnings Surprises | ||||||||||||||||||||||||||||||||||||||||||||||||||||||||||||||||||||||||||||||||||||||||||||||||||||||||||||||||||||||||||||||||||||||||||||||||||||||||||||||||||||||||||||
|
|
|
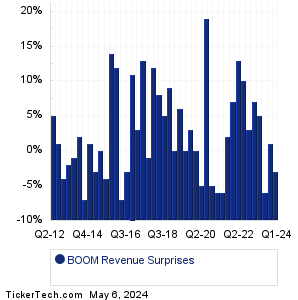
| BOOM Revenue Surprises | ||||||||||||||||||||||||||||||||||||||||||||||||||||||||||||||||||||||||||||||||||||||||||||||||||||||||||||||||||||||||||||||||||||||||||||||||||||||||||||||||||||||||||||
|
| BOOM Current Stock Quote |
Get Dividend Alerts Get SEC Filing Alerts |
| BOOM Stock Price Chart |
| Next Earnings Dates |
Next Earnings Date Calendar:Elevance Health (ELV): 4/18/2024 6:00 AMAlaska Air Gr (ALK): 4/18/2024 6:00 AM Texas Capital Bancshares (TCBI): 4/18/2024 6:00 AM Apogee Enterprises (APOG): 4/18/2024 6:15 AM D.R. Horton (DHI): 4/18/2024 6:30 AM Snap-on (SNA): 4/18/2024 6:30 AM KeyCorp (KEY): 4/18/2024 6:30 AM Forestar Group (FOR): 4/18/2024 6:30 AM Comerica (CMA): 4/18/2024 6:40 AM Genuine Parts (GPC): 4/18/2024 6:55 AM More from the Next Earnings Dates Calendar Earnings History:Great Southern Bancorp (GSBC): 4/17/2024 6:00 PMHome Bancorp (HBCP): 4/17/2024 5:14 PM Synovus Finl (SNV): 4/17/2024 5:00 PM First Industrial Realty (FR): 4/17/2024 After close William Penn (WMPN): 4/17/2024 After close Old Second Bancorp (OSBC): 4/17/2024 After close Liberty Energy (LBRT): 4/17/2024 After close F N B (FNB): 4/17/2024 After close Discover Finl (DFS): 4/17/2024 After close Wintrust Finl (WTFC): 4/17/2024 After close More from the Earnings History archive |
| Earnings Peers |
| DMC Glb (BOOM) is categorized under the Materials sector; to help you further research past earnings across stocks, below are some other companies in the same sector:
BTU Historical Earnings BXC Historical Earnings BYRN Historical Earnings CARR Historical Earnings CBT Historical Earnings CC Historical Earnings CCK Historical Earnings CDE Historical Earnings CDXS Historical Earnings CE Historical Earnings |
Click the button below for your complimentary copy of Your Early Retirement Portfolio: Dividends Up to 8.7%—Every Month—Forever.
You'll discover the details on 4 stocks and funds that pay you massive dividends as high as 8.7%.