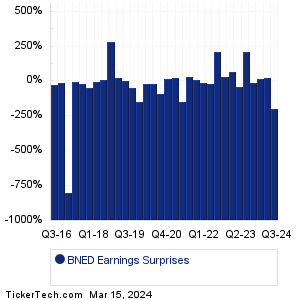
| BNED Earnings Surprises | ||||||||||||||||||||||||||||||||||||||||||||||||||||||||||||||||||||||||||||||||||||||||||||||||||||||||||||||||||||||||||||||||||||
|
|
|
| BNED Earnings Surprises | ||||||||||||||||||||||||||||||||||||||||||||||||||||||||||||||||||||||||||||||||||||||||||||||||||||||||||||||||||||||||||||||||||||
|
|
|
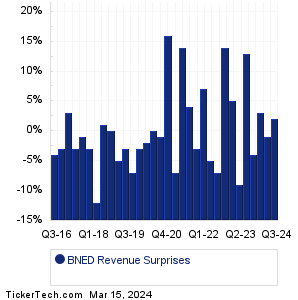
| BNED Revenue Surprises | ||||||||||||||||||||||||||||||||||||||||||||||||||||||||||||||||||||||||||||||||||||||||||||||||||||||||||||||||||||||||||||||||||||
|
| BNED Current Stock Quote |
Get Dividend Alerts Get SEC Filing Alerts |
| BNED Stock Price Chart |
| Next Earnings Dates |
Next Earnings Date Calendar:Atmus Filtration Techs (ATMU): 3/15/2024 5:54 AMTownsquare Media (TSQ): 3/15/2024 6:00 AM Hibbett (HIBB): 3/15/2024 6:30 AM Buckle (BKE): 3/15/2024 6:50 AM KVH Industries (KVHI): 3/15/2024 7:00 AM Jabil (JBL): 3/15/2024 7:30 AM ProPhase Labs (PRPH): 3/15/2024 8:00 AM Groupon (GRPN): 3/15/2024 8:00 AM Desktop Metal (DM): 3/15/2024 8:00 AM Tredegar (TG): 3/15/2024 8:00 AM More from the Next Earnings Dates Calendar Earnings History:Redwire (RDW): 3/14/2024 5:00 PMAkebia Therapeutics (AKBA): 3/14/2024 After close NuScale Power (SMR): 3/14/2024 After close Eastman Kodak (KODK): 3/14/2024 After close Alta Equipment Group (ALTG): 3/14/2024 After close Montauk Renewables (MNTK): 3/14/2024 After close Marchex (MCHX): 3/14/2024 After close CytoSorbents (CTSO): 3/14/2024 After close Babcock & Wilcox (BW): 3/14/2024 After close Karat Packaging (KRT): 3/14/2024 After close More from the Earnings History archive |
| Earnings Peers |
| Barnes & Noble Education (BNED) is categorized under the Services sector; to help you further research past earnings across stocks, below are some other companies in the same sector:
BOC Historical Earnings BODY Historical Earnings BOMN Historical Earnings BOOT Historical Earnings BOXL Historical Earnings BRDS Historical Earnings BRLT Historical Earnings BROS Historical Earnings BURL Historical Earnings BVH Historical Earnings |
Recommended: Institutional Holders of MLTI, CSGP Technical Analysis, TYC Split History.
Click the button below for your complimentary copy of Your Early Retirement Portfolio: Dividends Up to 9.5%—Every Month—Forever.
You'll discover the details on 4 stocks and funds that pay you massive dividends as high as 9.5%.