BMTC Earnings Surprises image   This BMTC earnings surprises page last updated 2/10/2022
BMTC Earnings Surprises Chart
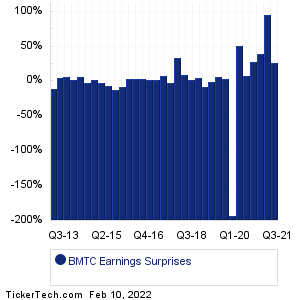
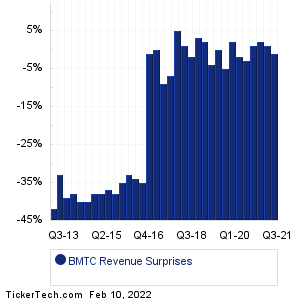
Data adjusted for BMTC split history

PeriodExpectedActualSurprise
Q3 2021 0.71 0.90 +0.19 (+27%)
Q2 2021 0.55 1.08 +0.53 (+96%)
Q1 2021 0.67 0.93 +0.26 (+39%)
Q4 2020 0.60 0.77 +0.17 (+28%)
Q3 2020 0.61 0.66 +0.05 (+8%)
Q2 2020 0.51 0.77 +0.26 (+51%)
Q1 2020 0.60 -0.56 -1.16 (-193%)
Q4 2019 0.78 0.81 +0.03 (+4%)
Q3 2019 0.76 0.81 +0.05 (+7%)
Q2 2019 0.79 0.78 -0.01 (-1%)
Q1 2019 0.76 0.70 -0.06 (-8%)
Q4 2018 0.80 0.84 +0.04 (+5%)
Q3 2018 0.82 0.84 +0.02 (+2%)
Q2 2018 0.76 0.83 +0.07 (+9%)
Q1 2018 0.70 0.94 +0.24 (+34%)
Q4 2017 0.64 0.63 -0.01 (-2%)
Q3 2017 0.60 0.65 +0.05 (+8%)
Q1 2017 0.54 0.55 +0.01 (+2%)
Q4 2016 0.54 0.55 +0.01 (+2%)
Q3 2016 0.53 0.55 +0.02 (+4%)
Q2 2016 0.51 0.53 +0.02 (+4%)
Q1 2016 0.47 0.49 +0.02 (+4%)
Q4 2015 0.48 0.44 -0.04 (-8%)
Q3 2015 0.52 0.46 -0.06 (-12%)
Q2 2015 0.53 0.50 -0.03 (-6%)
Q1 2015 0.52 0.51 -0.01 (-2%)
Q4 2014 0.50 0.51 +0.01 (+2%)
Q3 2014 0.52 0.51 -0.01 (-2%)
Q1 2014 0.46 0.49 +0.03 (+7%)
Q4 2013 0.46 0.47 +0.01 (+2%)
Q3 2013 0.44 0.47 +0.03 (+7%)
Q2 2013 0.44 0.46 +0.02 (+5%)
Q1 2013 0.45 0.40 -0.05 (-11%)
BMTC Revenue Surprises Chart
PeriodExpectedActualSurprise
Q3 2021 35.30M 34.89M -0.41M (-1%)
Q2 2021 34.95M 35.24M +289000 (+1%)
Q1 2021 34.13M 34.78M +651000 (+2%)
Q4 2020 34.83M 35.04M +207000 (+1%)
Q3 2020 36.06M 35.03M -1.03M (-3%)
Q2 2020 38.28M 37.38M -0.90M (-2%)
Q1 2020 35.68M 36.33M +653000 (+2%)
Q4 2019 37.81M 35.98M -1.82M (-5%)
Q3 2019 37.47M 37.40M -72000 (-0%)
Q2 2019 38.23M 36.61M -1.62M (-4%)
Q1 2019 37.09M 37.65M +557000 (+2%)
Q4 2018 37.04M 37.99M +947000 (+3%)
Q3 2018 37.34M 36.73M -0.61M (-2%)
Q2 2018 36.87M 37.32M +446000 (+1%)
Q1 2018 35.76M 37.44M +1.68M (+5%)
Q4 2017 32.58M 30.32M -2.26M (-7%)
Q3 2017 32.20M 29.44M -2.76M (-9%)
Q1 2017 27.42M 27.40M -17000 (-0%)
Q4 2016 27.27M 26.99M -0.28M (-1%)
Q3 2016 41.10M 26.72M -14.38M (-35%)
Q2 2016 40.07M 26.63M -13.44M (-34%)
Q1 2016 38.93M 25.90M -13.03M (-33%)
Q4 2015 38.83M 25.43M -13.40M (-35%)
Q3 2015 39.99M 24.83M -15.16M (-38%)
Q2 2015 40.00M 25.07M -14.93M (-37%)
Q1 2015 39.80M 24.80M -15.01M (-38%)
Q4 2014 31.40M 19.49M -11.91M (-38%)
Q3 2014 32.00M 19.18M -12.82M (-40%)
Q1 2014 31.03M 18.72M -12.31M (-40%)
Q4 2013 30.60M 19.12M -11.47M (-38%)
Q3 2013 30.61M 18.53M -12.08M (-39%)
Q2 2013 26.75M 17.92M -8.83M (-33%)
Q1 2013 29.78M 17.41M -12.37M (-42%)
Quotes delayed 20 minutes

Email EnvelopeFree BMTC Email Alerts:
Get Dividend Alerts
Get SEC Filing Alerts
10 Most Oversold S&P 500 Stocks
10 Most Overbought S&P 500 Stocks
10 ETFs With Stocks Insiders Are Buying
10 ETFs With Most Upside To Targets
The DividendRank Top 25
Warren Buffett Dividend Stocks
10 Cheap Dividend Stocks Under $10
10 Top DividendRank'ed Energy Stocks
The 10 Highest Yielding Preferred Stocks
The 15 Most Active S&P Call & Put Options

Next Earnings Date Calendar:

PepsiCo (PEP): 2/10/2022 6:00 AM
Linde (LIN): 2/10/2022 6:00 AM
Patterson-UTI Energy (PTEN): 2/10/2022 6:00 AM
Armada Hoffler Properties (AHH): 2/10/2022 6:00 AM
Zebra Technologies (ZBRA): 2/10/2022 6:30 AM
WEX (WEX): 2/10/2022 6:30 AM
Herc Holdings (HRI): 2/10/2022 6:30 AM
PBF Energy (PBF): 2/10/2022 6:30 AM
Blue Apron Holdings (APRN): 2/10/2022 6:30 AM
Laboratory Corp (LH): 2/10/2022 6:45 AM

More from the Next Earnings Dates Calendar

Earnings History:

Fluence Energy (FLNC): 2/9/2022 8:30 PM
Pilgrims Pride (PPC): 2/9/2022 6:45 PM
American Financial Group (AFG): 2/9/2022 5:00 PM
Phibro Animal Health (PAHC): 2/9/2022 After close
Two Harbors Investment (TWO): 2/9/2022 After close
ChampionX (CHX): 2/9/2022 After close
EQT (EQT): 2/9/2022 After close
O'Reilly Automotive (ORLY): 2/9/2022 After close
Evolution Petroleum (EPM): 2/9/2022 After close
Regional Management (RM): 2/9/2022 After close

More from the Earnings History archive
Bryn Mawr Bank (BMTC) is categorized under the Financials sector; to help you further research past earnings across stocks, below are some other companies in the same sector:

BNL Past Earnings
BOCH Past Earnings
BOH Past Earnings
BOKF Past Earnings
BPFH Past Earnings
BPOP Past Earnings
BPRN Past Earnings
BPYU Past Earnings
BR Past Earnings
BRDG Past Earnings
On this page we presented the BMTC earnings surprises information for Bryn Mawr Bank, comparing the expected earnings versus the actual earnings quarter by quarter, with the resulting positive or negative percentage surprise. Any self directed investor doing their due diligence on BMTC (or any other given stock) can benefit from researching all of the Bryn Mawr Bank past earnings going backwards in time, including how often the company beat or missed the market's expectations. To help you with this Bryn Mawr Bank earnings surprise research, on this page we presented each quarter's resulting numbers for easy comparison. Studying these numbers can help an investor by providing important context with which to think about BMTC's next earnings report. In your continued research on Bryn Mawr Bank we hope you will be sure to check out the further links included for revenue and earnings history as well as next earnings dates for BMTC. Thanks for visiting, and the next time you need to research BMTC earnings surprises or those of another stock, we hope you'll think of our site as your go-to earnings surprises research resource of choice.

Recommended: NBTB Price Target, Institutional Holders of UAUD, SRF YTD Return.


BMTC Earnings Surprises | www.NextEarningsDate.com | Copyright © 2020 - 2022, All Rights Reserved

Nothing in NextEarningsDate.com is intended to be investment advice, nor does it represent the opinion of, counsel from, or recommendations by BNK Invest Inc. or any of its affiliates, subsidiaries or partners. None of the information contained herein constitutes a recommendation that any particular security, portfolio, transaction, or investment strategy is suitable for any specific person. All viewers agree that under no circumstances will BNK Invest, Inc,. its subsidiaries, partners, officers, employees, affiliates, or agents be held liable for any loss or damage caused by your reliance on information obtained. By visiting, using or viewing this site, you agree to the following Full Disclaimer & Terms of Use and Privacy Policy. Video widget and market videos powered by Market News Video. Quote and option data delayed at least 15 minutes; stock quote data powered by Ticker Technologies, and Mergent.