| Blucora Earnings Surprises | ||||||||||||||||||||||||||||||||||||||||||||||||||||||||||||||||||||||||||||||||||||||||||||||||||||||||||||||||||||||||||||||||||||||||||||||||||||||||

|
|
|
| Blucora Earnings Surprises | ||||||||||||||||||||||||||||||||||||||||||||||||||||||||||||||||||||||||||||||||||||||||||||||||||||||||||||||||||||||||||||||||||||||||||||||||||||||||
|
|
|
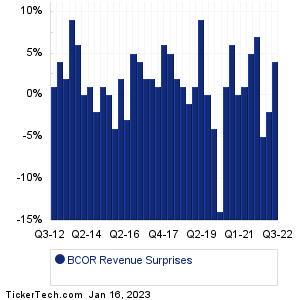
| BCOR Revenue Surprises | ||||||||||||||||||||||||||||||||||||||||||||||||||||||||||||||||||||||||||||||||||||||||||||||||||||||||||||||||||||||||||||||||||||||||||||||||||||||||
|
| BCOR Current Stock Quote |
Get Dividend Alerts Get SEC Filing Alerts |
| BCOR Stock Price Chart |
| Next Earnings Dates |
Next Earnings Date Calendar:Signature Bank (SBNY): 1/17/2023 5:00 AMMercantile Bank (MBWM): 1/17/2023 5:01 AM Citizens Financial Group (CFG): 1/17/2023 6:20 AM Silvergate Capital (SI): 1/17/2023 6:25 AM Guaranty Bancshares (GNTY): 1/17/2023 7:00 AM Goldman Sachs Group (GS): 1/17/2023 7:30 AM Morgan Stanley (MS): 1/17/2023 7:30 AM FB Financial (FBK): 1/17/2023 8:00 AM Interactive Brokers Group (IBKR): 1/17/2023 After close Hancock Whitney (HWC): 1/17/2023 After close More from the Next Earnings Dates Calendar Earnings History:T Stamp (IDAI): 1/13/2023 5:45 PMOcean Power Technologies (OPTT): 1/13/2023 After close Citigroup (C): 1/13/2023 8:00 AM Faraday Future (FFIE): 1/13/2023 7:45 AM First Republic Bank (FRC): 1/13/2023 7:00 AM Wells Fargo (WFC): 1/13/2023 6:45 AM Bank of America (BAC): 1/13/2023 6:45 AM JPMorgan Chase (JPM): 1/13/2023 6:45 AM Delta Air Lines (DAL): 1/13/2023 6:30 AM Bank of New York Mellon (BK): 1/13/2023 6:30 AM More from the Earnings History archive |
| Earnings Peers |
| Blucora (BCOR) is categorized under the Financials sector; to help you further research past earnings across stocks, below are some other companies in the same sector:
BCOW Historical Earnings BDN Historical Earnings BEN Historical Earnings BFC Historical Earnings BFIN Historical Earnings BFS Historical Earnings BFST Historical Earnings BGCP Historical Earnings BHF Historical Earnings BHLB Historical Earnings |