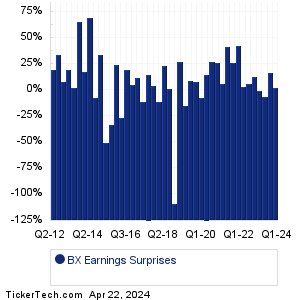
| Blackstone Earnings Surprises | ||||||||||||||||||||||||||||||||||||||||||||||||||||||||||||||||||||||||||||||||||||||||||||||||||||||||||||||||||||||||||||||||||||||||||||||||||||||||||||||||||||
|
|
|
| Blackstone Earnings Surprises | ||||||||||||||||||||||||||||||||||||||||||||||||||||||||||||||||||||||||||||||||||||||||||||||||||||||||||||||||||||||||||||||||||||||||||||||||||||||||||||||||||||
|
|
|
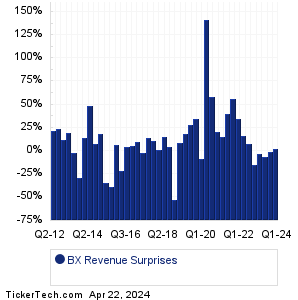
| BX Revenue Surprises | ||||||||||||||||||||||||||||||||||||||||||||||||||||||||||||||||||||||||||||||||||||||||||||||||||||||||||||||||||||||||||||||||||||||||||||||||||||||||||||||||||||
|
| BX Current Stock Quote |
Get Dividend Alerts Get SEC Filing Alerts |
| BX Stock Price Chart |
| Next Earnings Dates |
Next Earnings Date Calendar:Bank of Hawaii (BOH): 7/24/2023 6:45 AMHBT Finl (HBT): 7/24/2023 7:05 AM Domino's Pizza (DPZ): 7/24/2023 7:30 AM Hope Bancorp (HOPE): 7/24/2023 8:00 AM Dynex Cap (DX): 7/24/2023 8:00 AM Applied Digital (APLD): 7/24/2023 8:00 AM Bank of Marin (BMRC): 7/24/2023 8:30 AM AGNC Investment (AGNC): 7/24/2023 After close Trustco Bank (TRST): 7/24/2023 After close Community Finl (TCFC): 7/24/2023 After close More from the Next Earnings Dates Calendar Earnings History:ARCA biopharma (ABIO): 7/21/2023 After closeJohn Marshall Bancorp (JMSB): 7/21/2023 After close Friedman Industries (FRD): 7/21/2023 After close Sitio Royalties (STR): 7/21/2023 After close Bank of the James Finl Gr (BOTJ): 7/21/2023 12:00 PM MetroCity Bankshares (MCBS): 7/21/2023 10:00 AM Lakeland Financial (LKFN): 7/21/2023 10:00 AM Acme United (ACU): 7/21/2023 9:00 AM Tompkins Finl (TMP): 7/21/2023 9:00 AM LCNB (LCNB): 7/21/2023 8:00 AM More from the Earnings History archive |
| Earnings Peers |
| Blackstone (BX) is categorized under the Financials sector; to help you further research past earnings across stocks, below are some other companies in the same sector:
BXMT Historical Earnings BXP Historical Earnings BXS Historical Earnings BY Historical Earnings BYFC Historical Earnings C Historical Earnings CAC Historical Earnings CACC Historical Earnings CADE Historical Earnings CALB Historical Earnings |
Recommended: FSLF Insider Buying, Institutional Holders of DIAX, Funds Holding JFU.
Click the button below for your complimentary copy of Your Early Retirement Portfolio: Dividends Up to 7.8%—Every Month—Forever.
You'll discover the details on 4 stocks and funds that pay you massive dividends as high as 7.8%.