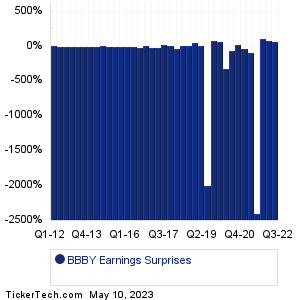
| Bed Bath & Beyond Earnings Surprises | ||||||||||||||||||||||||||||||||||||||||||||||||||||||||||||||||||||||||||||||||||||||||||||||||||||||||||||||||||||||||||||||||||||||||||||||||||||||||
|
|
|
| Bed Bath & Beyond Earnings Surprises | ||||||||||||||||||||||||||||||||||||||||||||||||||||||||||||||||||||||||||||||||||||||||||||||||||||||||||||||||||||||||||||||||||||||||||||||||||||||||
|
|
|
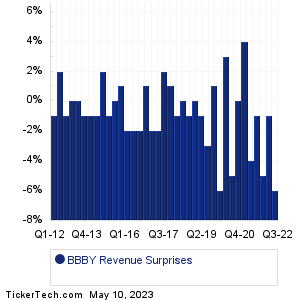
| BBBY Revenue Surprises | ||||||||||||||||||||||||||||||||||||||||||||||||||||||||||||||||||||||||||||||||||||||||||||||||||||||||||||||||||||||||||||||||||||||||||||||||||||||||
|
| BBBY Current Stock Quote |
Get Dividend Alerts Get SEC Filing Alerts |
| BBBY Stock Price Chart |
| Next Earnings Dates |
Next Earnings Date Calendar:Coherent (COHR): 5/10/2023 6:00 AMSyneos Health (SYNH): 5/10/2023 6:00 AM Global Net Lease (GNL): 5/10/2023 6:00 AM First Advantage (FA): 5/10/2023 6:00 AM LifeStance Health Gr (LFST): 5/10/2023 6:00 AM CURO Group Holdings (CURO): 5/10/2023 6:00 AM Everi Hldgs (EVRI): 5/10/2023 6:15 AM First Citizens BancShares (FCNCA): 5/10/2023 6:30 AM Hecla Mining (HL): 5/10/2023 6:30 AM Wolverine World Wide (WWW): 5/10/2023 6:30 AM More from the Next Earnings Dates Calendar Earnings History:Mesa Air Gr (MESA): 5/9/2023 5:34 PMPsychemedics (PMD): 5/9/2023 5:30 PM Ziff Davis (ZD): 5/9/2023 5:30 PM Hyliion Holdings (HYLN): 5/9/2023 5:23 PM Atlanticus Holdings (ATLC): 5/9/2023 5:22 PM Legacy Housing (LEGH): 5/9/2023 5:15 PM Skyward Specialty (SKWD): 5/9/2023 5:07 PM Ovintiv (OVV): 5/9/2023 5:05 PM Maiden Hldgs (MHLD): 5/9/2023 5:00 PM Granite Point Mortgage (GPMT): 5/9/2023 After close More from the Earnings History archive |
| Earnings Peers |
| Bed Bath & Beyond (BBBY) is categorized under the Services sector; to help you further research past earnings across stocks, below are some other companies in the same sector:
BBGI Historical Earnings BBQ Historical Earnings BBW Historical Earnings BBWI Historical Earnings BBY Historical Earnings BFAM Historical Earnings BFI Historical Earnings BGFV Historical Earnings BH Historical Earnings BHR Historical Earnings |
Recommended: SNEY Insider Buying, CYB Historical Stock Prices, NH Average Annual Return.
Click the button below for your complimentary copy of Your Early Retirement Portfolio: Dividends Up to 7.8%—Every Month—Forever.
You'll discover the details on 4 stocks and funds that pay you massive dividends as high as 7.8%.