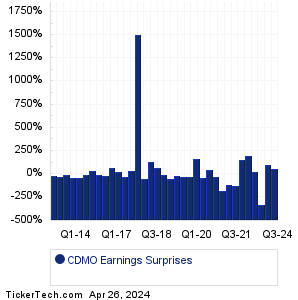
| Avid Bioservices Earnings Surprises | ||||||||||||||||||||||||||||||||||||||||||||||||||||||||||||||||||||||||||||||||||||||||||||||||||||||||||||||||||||||||||||||||||||||||||||||||
|
|
|
| Avid Bioservices Earnings Surprises | ||||||||||||||||||||||||||||||||||||||||||||||||||||||||||||||||||||||||||||||||||||||||||||||||||||||||||||||||||||||||||||||||||||||||||||||||
|
|
|
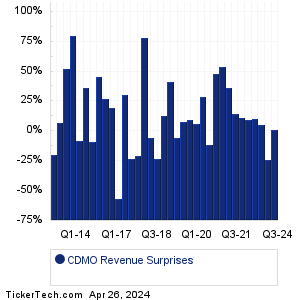
| CDMO Revenue Surprises | ||||||||||||||||||||||||||||||||||||||||||||||||||||||||||||||||||||||||||||||||||||||||||||||||||||||||||||||||||||||||||||||||||||||||||||||||
|
| CDMO Current Stock Quote |
Get Dividend Alerts Get SEC Filing Alerts |
| CDMO Stock Price Chart |
| Next Earnings Dates |
Next Earnings Date Calendar:Allegion (ALLE): 4/25/2024 5:30 AMSouthside Bancshares (SBSI): 4/25/2024 5:45 AM Dow (DOW): 4/25/2024 6:00 AM Xcel Energy (XEL): 4/25/2024 6:00 AM West Pharmaceutical Servs (WST): 4/25/2024 6:00 AM Willis Towers Watson (WTW): 4/25/2024 6:00 AM FirstCash Hldgs (FCFS): 4/25/2024 6:00 AM Escalade (ESCA): 4/25/2024 6:00 AM Tri Pointe Homes (TPH): 4/25/2024 6:00 AM Arch Resources (ARCH): 4/25/2024 6:00 AM More from the Next Earnings Dates Calendar Earnings History:Waste Management (WM): 4/24/2024 7:00 PMHelix Energy Solns Gr (HLX): 4/24/2024 6:05 PM First Bancshares (FBMS): 4/24/2024 5:47 PM Avid Bioservices (CDMO): 4/24/2024 5:25 PM Amerant Bancorp (AMTB): 4/24/2024 5:23 PM Bankwell Finl Gr (BWFG): 4/24/2024 5:22 PM Teradyne (TER): 4/24/2024 5:22 PM Core Laboratories (CLB): 4/24/2024 5:15 PM Oceaneering International (OII): 4/24/2024 5:01 PM NewMarket (NEU): 4/24/2024 5:00 PM More from the Earnings History archive |
| Earnings Peers |
| Avid Bioservices (CDMO) is categorized under the Healthcare sector; to help you further research past earnings across stocks, below are some other companies in the same sector:
CDNA Historical Earnings CDRE Historical Earnings CDTX Historical Earnings CDXC Historical Earnings CELC Historical Earnings CELL Historical Earnings CEMI Historical Earnings CERC Historical Earnings CERE Historical Earnings CERS Historical Earnings |
Click the button below for your complimentary copy of Your Early Retirement Portfolio: Dividends Up to 8.7%—Every Month—Forever.
You'll discover the details on 4 stocks and funds that pay you massive dividends as high as 8.7%.