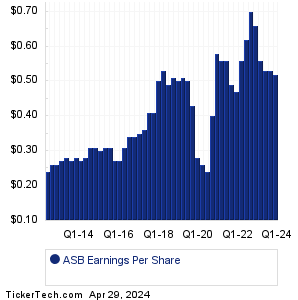
| Associated Banc Earnings History | ||||||||||||||||||||||||||||||||||||||||||||||||||||||||||||||||||||||||||||||||||||||||||||||||||||||||||||||||||||||||||||||||||||||||||||||||
|
|
|
| Associated Banc Earnings History | ||||||||||||||||||||||||||||||||||||||||||||||||||||||||||||||||||||||||||||||||||||||||||||||||||||||||||||||||||||||||||||||||||||||||||||||||
|
|
|
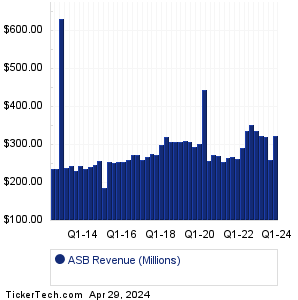
| ASB Revenue History | ||||||||||||||||||||||||||||||||||||||||||||||||||||||||||||||||||||||||||||||||||||||||||||||||||||||||||||||||||||||||||||||||||||||||||||||||
|
| ASB Current Stock Quote |
Get Dividend Alerts Get SEC Filing Alerts |
| ASB Stock Price Chart |
| Next Earnings Dates |
Next Earnings Date Calendar:Celsius Holdings (CELH): 3/29/2024 8:00 AMY-mAbs Therapeutics (YMAB): 3/29/2024 After close Escalade (ESCA): 4/1/2024 6:00 AM ZeroFox Holdings (ZFOX): 4/1/2024 6:00 AM Terran Orbital (LLAP): 4/1/2024 6:30 AM Alimera Sciences (ALIM): 4/1/2024 7:00 AM Avrobio (AVRO): 4/1/2024 7:00 AM DecisionPoint Sys (DPSI): 4/1/2024 7:00 AM AlloVir (ALVR): 4/1/2024 7:00 AM Milestone Scientific (MLSS): 4/1/2024 7:00 AM More from the Next Earnings Dates Calendar Earnings History:Predictive Oncology (POAI): 3/28/2024 5:28 PMAqua Metals (AQMS): 3/28/2024 5:21 PM Cadiz (CDZI): 3/28/2024 After close Zevra Therapeutics (ZVRA): 3/28/2024 After close Shapeways Hldgs (SHPW): 3/28/2024 After close Maui Land & Pineapple Co (MLP): 3/28/2024 After close NSTS Bancorp (NSTS): 3/28/2024 After close Verde Clean Fuels (VGAS): 3/28/2024 After close Semtech (SMTC): 3/28/2024 After close Pulse Biosciences (PLSE): 3/28/2024 After close More from the Earnings History archive |
| Featured Articles |
| Earnings Peers |
| Associated Banc (ASB) is categorized under the Financials sector; to help you further research past earnings across stocks, below are some other companies in the same sector:
ASRV Past Earnings ATLC Past Earnings ATLO Past Earnings AUB Past Earnings AUBN Past Earnings AVB Past Earnings AVTA Past Earnings AX Past Earnings AXP Past Earnings AXR Past Earnings |
Recommended: ICEL Historical Stock Prices, Top Ten Hedge Funds Holding UMMA, SLVP Videos.
Click the button below for your complimentary copy of Your Early Retirement Portfolio: Dividends Up to 9.5%—Every Month—Forever.
You'll discover the details on 4 stocks and funds that pay you massive dividends as high as 9.5%.