| AROW Earnings Surprises | ||||||||||||||||||||||||||||||||||||||||||||||||||||||||||||||||||||||||||||||||||||||||||||||||||||||||||||||||||||||||||||||||||||||||||||||||||||
|
|
|
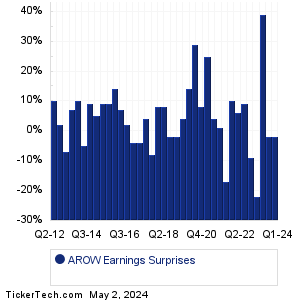
| AROW Earnings Surprises | ||||||||||||||||||||||||||||||||||||||||||||||||||||||||||||||||||||||||||||||||||||||||||||||||||||||||||||||||||||||||||||||||||||||||||||||||||||
|
|
|
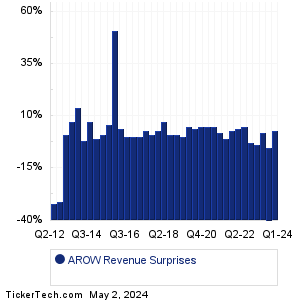
| AROW Revenue Surprises | ||||||||||||||||||||||||||||||||||||||||||||||||||||||||||||||||||||||||||||||||||||||||||||||||||||||||||||||||||||||||||||||||||||||||||||||||||||
|
| AROW Current Stock Quote |
Get Dividend Alerts Get SEC Filing Alerts |
| AROW Stock Price Chart |
| Next Earnings Dates |
Next Earnings Date Calendar:Air Products & Chemicals (APD): 2/5/2024 6:00 AMLoews (L): 2/5/2024 6:00 AM Caterpillar (CAT): 2/5/2024 6:30 AM IDEXX Laboratories (IDXX): 2/5/2024 6:30 AM Graham (GHM): 2/5/2024 6:30 AM Estee Lauder Cos (EL): 2/5/2024 6:45 AM Timken (TKR): 2/5/2024 6:51 AM McDonald's (MCD): 2/5/2024 7:00 AM Affiliated Managers Group (AMG): 2/5/2024 7:00 AM Tyson Foods (TSN): 2/5/2024 7:30 AM More from the Next Earnings Dates Calendar Earnings History:United States Lime (USLM): 2/2/2024 After closeBank of the James Finl Gr (BOTJ): 2/2/2024 1:00 PM Piper Sandler (PIPR): 2/2/2024 8:00 AM W.W. Grainger (GWW): 2/2/2024 8:00 AM IES Hldgs (IESC): 2/2/2024 7:45 AM AbbVie (ABBV): 2/2/2024 7:44 AM Twist Bioscience (TWST): 2/2/2024 7:30 AM Saia (SAIA): 2/2/2024 7:30 AM Cboe Global Markets (CBOE): 2/2/2024 7:30 AM WisdomTree (WT): 2/2/2024 7:00 AM More from the Earnings History archive |
| Earnings Peers |
| Arrow Financial (AROW) is categorized under the Financials sector; to help you further research past earnings across stocks, below are some other companies in the same sector:
ARR Historical Earnings ASB Historical Earnings ASRV Historical Earnings ATLC Historical Earnings ATLO Historical Earnings AUB Historical Earnings AUBN Historical Earnings AVB Historical Earnings AVTA Historical Earnings AX Historical Earnings |
Recommended: RWM Videos, ABDC shares outstanding history, EPAX Split History.
Click the button below for your complimentary copy of Your Early Retirement Portfolio: Dividends Up to 9.5%—Every Month—Forever.
You'll discover the details on 4 stocks and funds that pay you massive dividends as high as 9.5%.