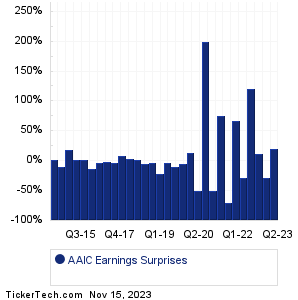
| Arlington Asset Inv Earnings Surprises | ||||||||||||||||||||||||||||||||||||||||||||||||||||||||||||||||||||||||||||||||||||||||||||||||||||||||||||||||||||||||
|
|
|
| Arlington Asset Inv Earnings Surprises | ||||||||||||||||||||||||||||||||||||||||||||||||||||||||||||||||||||||||||||||||||||||||||||||||||||||||||||||||||||||||
|
|
|
| AAIC Revenue Surprises | ||||||||||||||||||||||||||||||||||||||||||||||||||||||||||||||||||||||||||||||||||||||||||||||||||||||||||||||||||||||||
|
| AAIC Current Stock Quote |
Get Dividend Alerts Get SEC Filing Alerts |
| AAIC Stock Price Chart |
| Next Earnings Dates |
Next Earnings Date Calendar:Triumph Group (TGI): 5/17/2023 6:00 AMTarget (TGT): 5/17/2023 6:30 AM Dynatrace (DT): 5/17/2023 6:30 AM TJX Companies (TJX): 5/17/2023 7:30 AM Lightning eMotors (ZEV): 5/17/2023 8:00 AM Jack In The Box (JACK): 5/17/2023 8:30 AM Viasat (VSAT): 5/17/2023 After close Cisco Systems (CSCO): 5/17/2023 After close Synopsys (SNPS): 5/17/2023 After close Take-Two Interactive (TTWO): 5/17/2023 After close More from the Next Earnings Dates Calendar Earnings History:ClearOne (CLRO): 5/16/2023 10:21 PMPAVmed (PAVM): 5/16/2023 5:00 PM First Guaranty Bancshares (FGBI): 5/16/2023 5:00 PM Kyndryl Hldgs (KD): 5/16/2023 After close BurgerFi International (BFI): 5/16/2023 After close GSI Technology (GSIT): 5/16/2023 After close QuickLogic (QUIK): 5/16/2023 After close Container Store Group (TCS): 5/16/2023 After close NextGen Healthcare (NXGN): 5/16/2023 After close Agilysys (AGYS): 5/16/2023 After close More from the Earnings History archive |
| Earnings Peers |
| Arlington Asset Inv (AAIC) is categorized under the Financials sector; to help you further research past earnings across stocks, below are some other companies in the same sector:
AAME Historical Earnings AAT Historical Earnings ABCB Historical Earnings ABR Historical Earnings ABTX Historical Earnings AC Historical Earnings ACBI Historical Earnings ACC Historical Earnings ACGL Historical Earnings ACNB Historical Earnings |
Click the button below for your complimentary copy of Your Early Retirement Portfolio: Dividends Up to 7.8%—Every Month—Forever.
You'll discover the details on 4 stocks and funds that pay you massive dividends as high as 7.8%.