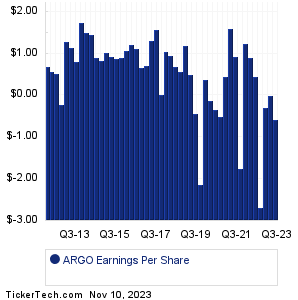
| ARGO Earnings History | ||||||||||||||||||||||||||||||||||||||||||||||||||||||||||||||||||||||||||||||||||||||||||||||||||||||||||||||||||||||||||||||||||||||||||||||||
|
|
|
| ARGO Earnings History | ||||||||||||||||||||||||||||||||||||||||||||||||||||||||||||||||||||||||||||||||||||||||||||||||||||||||||||||||||||||||||||||||||||||||||||||||
|
|
|
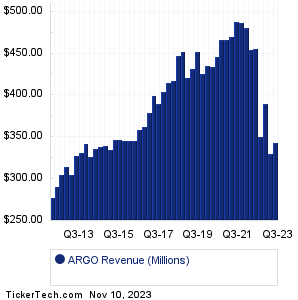
| ARGO Revenue History | ||||||||||||||||||||||||||||||||||||||||||||||||||||||||||||||||||||||||||||||||||||||||||||||||||||||||||||||||||||||||||||||||||||||||||||||||
|
| ARGO Current Stock Quote |
Get Dividend Alerts Get SEC Filing Alerts |
| ARGO Stock Price Chart |
| Next Earnings Dates |
Next Earnings Date Calendar:The Real Good Food (RGF): 11/10/2023 7:30 AMLongeveron (LGVN): 11/10/2023 7:30 AM Inuvo (INUV): 11/10/2023 8:00 AM Dixie Gr (DXYN): 11/10/2023 8:00 AM Sunworks (SUNW): 11/10/2023 9:00 AM Fiserv (FI): 11/12/2023 12:48 PM Circor Intl (CIR): 11/13/2023 6:00 AM Henry Schein (HSIC): 11/13/2023 6:30 AM Moleculin Biotech (MBRX): 11/13/2023 6:45 AM Fortrea Holdings (FTRE): 11/13/2023 7:00 AM More from the Next Earnings Dates Calendar Earnings History:Turnstone Biologics (TSBX): 11/9/2023 9:49 PMUnited Homes Gr (UHG): 11/9/2023 6:15 PM Verra Mobility (VRRM): 11/9/2023 5:24 PM Creative Realities (CREX): 11/9/2023 5:00 PM Psychemedics (PMD): 11/9/2023 5:00 PM Tredegar (TG): 11/9/2023 5:00 PM Nuvve Holding (NVVE): 11/9/2023 After close Team (TISI): 11/9/2023 After close Babcock & Wilcox (BW): 11/9/2023 After close Groupon (GRPN): 11/9/2023 After close More from the Earnings History archive |
| Featured Articles |
| Earnings Peers |
| Argo Gr Intl Hldgs (ARGO) is categorized under the Miscellaneous sector; to help you further research past earnings across stocks, below are some other companies in the same sector:
ASTR Past Earnings ASTS Past Earnings AVPT Past Earnings AXTA Past Earnings BBAI Past Earnings BGRY Past Earnings BHIL Past Earnings BHVN Past Earnings BKKT Past Earnings BKSY Past Earnings |
Recommended: FR Stock Predictions, Funds Holding OLBK, QRHC Average Annual Return.
Click the button below for your complimentary copy of Your Early Retirement Portfolio: Dividends Up to 9.5%—Every Month—Forever.
You'll discover the details on 4 stocks and funds that pay you massive dividends as high as 9.5%.