| Applied Mat Earnings Surprises | ||||||||||||||||||||||||||||||||||||||||||||||||||||||||||||||||||||||||||||||||||||||||||||||||||||||||||||||||||||||||||||||||||||||||||||||||||||||||||||||||||||

|
|
|
| Applied Mat Earnings Surprises | ||||||||||||||||||||||||||||||||||||||||||||||||||||||||||||||||||||||||||||||||||||||||||||||||||||||||||||||||||||||||||||||||||||||||||||||||||||||||||||||||||||
|
|
|
| AMAT Revenue Surprises | ||||||||||||||||||||||||||||||||||||||||||||||||||||||||||||||||||||||||||||||||||||||||||||||||||||||||||||||||||||||||||||||||||||||||||||||||||||||||||||||||||||
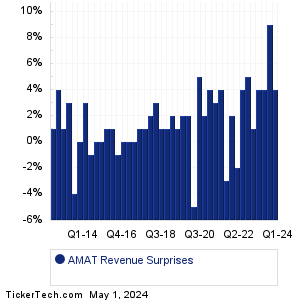
|
| AMAT Current Stock Quote |
Get Dividend Alerts Get SEC Filing Alerts |
| AMAT Stock Price Chart |
| Next Earnings Dates |
Next Earnings Date Calendar:Tingo Group (TIO): 8/21/2023 7:00 AMApplied UV (AUVI): 8/21/2023 8:00 AM Zoom Video Comms (ZM): 8/21/2023 After close Faraday Future (FFIE): 8/21/2023 After close Flexsteel Industries (FLXS): 8/21/2023 After close Fabrinet (FN): 8/21/2023 After close Nordson (NDSN): 8/21/2023 After close Lowe's Companies (LOW): 8/22/2023 6:00 AM Coty (COTY): 8/22/2023 6:30 AM Premier (PINC): 8/22/2023 6:30 AM More from the Next Earnings Dates Calendar Earnings History:Palo Alto Networks (PANW): 8/18/2023 After closeMaui Land & Pineapple Co (MLP): 8/18/2023 After close Leonardo DRS (DRS): 8/18/2023 After close Madison Square Garden (MSGE): 8/18/2023 7:30 AM Partners Bancorp (PTRS): 8/18/2023 7:00 AM Buckle (BKE): 8/18/2023 6:50 AM Estee Lauder Cos (EL): 8/18/2023 6:45 AM Deere (DE): 8/18/2023 6:07 AM GE HealthCare Techs (GEHC): 8/18/2023 2:01 AM Vitesse Energy (VTS): 8/18/2023 1:18 AM More from the Earnings History archive |
| Earnings Peers |
| Applied Mat (AMAT) is categorized under the Technology sector; to help you further research past earnings across stocks, below are some other companies in the same sector:
AMBA Historical Earnings AMD Historical Earnings AMKR Historical Earnings AMPG Historical Earnings AMPL Historical Earnings AMST Historical Earnings ANET Historical Earnings ANGI Historical Earnings ANSS Historical Earnings AOSL Historical Earnings |
Recommended: AGD Videos, BKSC shares outstanding history, RMI Insider Buying.
Click the button below for your complimentary copy of Your Early Retirement Portfolio: Dividends Up to 7.8%—Every Month—Forever.
You'll discover the details on 4 stocks and funds that pay you massive dividends as high as 7.8%.