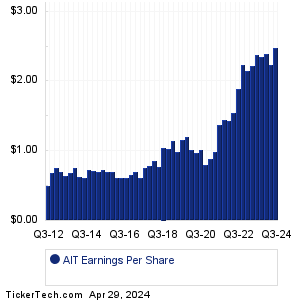
| Applied Industrial Earnings History | ||||||||||||||||||||||||||||||||||||||||||||||||||||||||||||||||||||||||||||||||||||||||||||||||||||||||||||||||||||||||||||||||||||||||||||||||
|
|
|
| Applied Industrial Earnings History | ||||||||||||||||||||||||||||||||||||||||||||||||||||||||||||||||||||||||||||||||||||||||||||||||||||||||||||||||||||||||||||||||||||||||||||||||
|
|
|
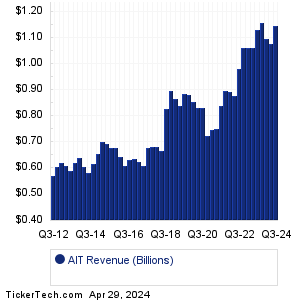
| AIT Revenue History | ||||||||||||||||||||||||||||||||||||||||||||||||||||||||||||||||||||||||||||||||||||||||||||||||||||||||||||||||||||||||||||||||||||||||||||||||
|
| AIT Current Stock Quote |
Get Dividend Alerts Get SEC Filing Alerts |
| AIT Stock Price Chart |
| Next Earnings Dates |
Next Earnings Date Calendar:22nd Century Group (XXII): 8/14/2023 6:00 AMRockwell Medical (RMTI): 8/14/2023 6:00 AM Superior Drilling Prods (SDPI): 8/14/2023 6:30 AM Modiv (MDV): 8/14/2023 6:45 AM 2seventy bio (TSVT): 8/14/2023 7:00 AM BioXcel Therapeutics (BTAI): 8/14/2023 7:00 AM Zevra Therapeutics (ZVRA): 8/14/2023 7:00 AM Berkshire Grey (BGRY): 8/14/2023 7:00 AM Broadwind (BWEN): 8/14/2023 7:00 AM Sonida Senior Living (SNDA): 8/14/2023 7:00 AM More from the Next Earnings Dates Calendar Earnings History:Patriot Ntl Bancorp (PNBK): 8/11/2023 6:00 PMPsychemedics (PMD): 8/11/2023 5:00 PM Barnwell Industries (BRN): 8/11/2023 After close vTv Therapeutics (VTVT): 8/11/2023 After close Air T (AIRT): 8/11/2023 After close Global Self Storage (SELF): 8/11/2023 After close Midwest Holding (MDWT): 8/11/2023 After close Jasper Therapeutics (JSPR): 8/11/2023 After close Safe & Green Holdings (SGBX): 8/11/2023 After close Volcon (VLCN): 8/11/2023 After close More from the Earnings History archive |
| Featured Articles |
| Earnings Peers |
| Applied Industrial (AIT) is categorized under the Industrials sector; to help you further research past earnings across stocks, below are some other companies in the same sector:
AJRD Past Earnings AL Past Earnings ALG Past Earnings ALGT Past Earnings ALJJ Past Earnings ALK Past Earnings ALTG Past Earnings AME Past Earnings AMOT Past Earnings AMRC Past Earnings |
Recommended: Funds Holding RATE, FBZ Videos, HURN Options Chain.
Click the button below for your complimentary copy of Your Early Retirement Portfolio: Dividends Up to 7.8%—Every Month—Forever.
You'll discover the details on 4 stocks and funds that pay you massive dividends as high as 7.8%.