ANTM Earnings Surprises image   This ANTM earnings surprises page last updated 4/22/2022
ANTM Earnings Surprises Chart
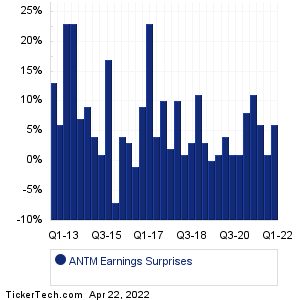
Data adjusted for ANTM split history

PeriodExpectedActualSurprise
Q1 2022 7.81 8.25 +0.44 (+6%)
Q4 2021 5.11 5.14 +0.03 (+1%)
Q3 2021 6.39 6.79 +0.40 (+6%)
Q2 2021 6.33 7.03 +0.70 (+11%)
Q1 2021 6.51 7.01 +0.50 (+8%)
Q4 2020 2.52 2.54 +0.02 (+1%)
Q3 2020 4.15 4.20 +0.05 (+1%)
Q2 2020 8.87 9.20 +0.33 (+4%)
Q3 2019 4.82 4.87 +0.05 (+1%)
Q2 2019 4.62 4.64 +0.02 (0%)
Q1 2019 5.83 6.03 +0.20 (+3%)
Q4 2018 2.19 2.44 +0.25 (+11%)
Q3 2018 3.70 3.81 +0.11 (+3%)
Q2 2018 4.20 4.25 +0.05 (+1%)
Q1 2018 4.91 5.41 +0.50 (+10%)
Q4 2017 1.27 1.29 +0.02 (+2%)
Q3 2017 2.41 2.65 +0.24 (+10%)
Q2 2017 3.23 3.37 +0.14 (+4%)
Q1 2017 3.80 4.68 +0.88 (+23%)
Q4 2016 1.61 1.76 +0.15 (+9%)
Q3 2016 2.48 2.45 -0.03 (-1%)
Q2 2016 3.23 3.33 +0.10 (+3%)
Q1 2016 3.32 3.46 +0.14 (+4%)
Q4 2015 1.22 1.14 -0.08 (-7%)
Q3 2015 2.33 2.73 +0.40 (+17%)
Q4 2014 1.71 1.73 +0.02 (+1%)
Q3 2014 2.26 2.36 +0.10 (+4%)
Q2 2014 2.24 2.44 +0.20 (+9%)
Q1 2014 2.14 2.30 +0.16 (+7%)
Q2 2013 2.11 2.60 +0.49 (+23%)
Q1 2013 2.39 2.94 +0.55 (+23%)
Q4 2012 0.97 1.03 +0.06 (+6%)
Q3 2012 1.85 2.09 +0.24 (+13%)
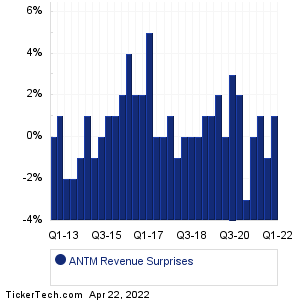
ANTM Revenue Surprises Chart
PeriodExpectedActualSurprise
Q1 2022 37.42B 37.89B +466.00M (+1%)
Q4 2021 36.51B 36.02B -0.49B (-1%)
Q3 2021 35.30B 35.55B +248.00M (+1%)
Q2 2021 33.21B 33.28B +69.00M (0%)
Q1 2021 32.94B 32.10B -0.84B (-3%)
Q4 2020 30.78B 31.53B +753.00M (+2%)
Q3 2020 29.75B 30.65B +899.00M (+3%)
Q2 2020 29.25B 29.18B -72.00M (-0%)
Q3 2019 25.90B 26.44B +544.00M (+2%)
Q2 2019 24.91B 25.18B +267.00M (+1%)
Q1 2019 24.26B 24.39B +128.00M (+1%)
Q4 2018 23.38B 23.30B -76.00M (-0%)
Q3 2018 22.93B 22.98B +50.00M (0%)
Q2 2018 22.71B 22.71B +5.00M (0%)
Q1 2018 22.54B 22.34B -0.20B (-1%)
Q4 2017 22.25B 22.45B +197.00M (+1%)
Q3 2017 22.01B 22.10B +87.00M (0%)
Q2 2017 22.26B 22.20B -62.00M (-0%)
Q1 2017 21.26B 22.32B +1.06B (+5%)
Q4 2016 20.97B 21.48B +515.00M (+2%)
Q3 2016 20.76B 21.12B +365.00M (+2%)
Q2 2016 20.53B 21.27B +745.00M (+4%)
Q1 2016 19.86B 20.31B +449.00M (+2%)
Q4 2015 19.90B 20.02B +124.00M (+1%)
Q3 2015 19.64B 19.77B +131.00M (+1%)
Q4 2014 19.01B 18.98B -26.00M (-0%)
Q3 2014 18.72B 18.60B -0.12B (-1%)
Q2 2014 18.24B 18.47B +230.00M (+1%)
Q1 2014 17.96B 17.86B -0.10B (-1%)
Q2 2013 17.89B 17.60B -0.29B (-2%)
Q1 2013 18.05B 17.69B -0.36B (-2%)
Q4 2012 15.36B 15.54B +180.00M (+1%)
Q3 2012 15.33B 15.35B +20.00M (0%)
Quotes delayed 20 minutes

Email EnvelopeFree ANTM Email Alerts:
Get Dividend Alerts
Get SEC Filing Alerts
10 Most Oversold S&P 500 Stocks
10 Most Overbought S&P 500 Stocks
10 ETFs With Stocks Insiders Are Buying
10 ETFs With Most Upside To Targets
The DividendRank Top 25
Warren Buffett Dividend Stocks
10 Cheap Dividend Stocks Under $10
10 Top DividendRank'ed Energy Stocks
The 10 Highest Yielding Preferred Stocks
The 15 Most Active S&P Call & Put Options

Next Earnings Date Calendar:

Petros Pharmaceuticals (PTPI): 4/22/2022 5:32 AM
Regions Financial (RF): 4/22/2022 6:00 AM
AZZ (AZZ): 4/22/2022 6:30 AM
Verizon Communications (VZ): 4/22/2022 7:00 AM
American Express (AXP): 4/22/2022 7:00 AM
Schlumberger (SLB): 4/22/2022 7:00 AM
Newmont Goldcorp (NEM): 4/22/2022 7:00 AM
Cleveland-Cliffs (CLF): 4/22/2022 7:00 AM
HCA Healthcare (HCA): 4/22/2022 7:30 AM
Kimberly-Clark (KMB): 4/22/2022 7:30 AM

More from the Next Earnings Dates Calendar

Earnings History:

Hilltop Holdings (HTH): 4/21/2022 5:15 PM
CapStar Financial Hldgs (CSTR): 4/21/2022 5:00 PM
Metropolitan Bank Holding (MCB): 4/21/2022 After close
Glacier Bancorp (GBCI): 4/21/2022 After close
FirstEnergy (FE): 4/21/2022 After close
SVB Financial (SIVB): 4/21/2022 After close
First Financial Bancorp (FFBC): 4/21/2022 After close
Independent Bank (INDB): 4/21/2022 After close
Qualtrics International (XM): 4/21/2022 After close
Alpine Income Prop Trust (PINE): 4/21/2022 After close

More from the Earnings History archive
Anthem (ANTM) is categorized under the Financials sector; to help you further research past earnings across stocks, below are some other companies in the same sector:

AOMR Past Earnings
AON Past Earnings
APAM Past Earnings
APLE Past Earnings
APO Past Earnings
APTS Past Earnings
ARE Past Earnings
ARES Past Earnings
ARI Past Earnings
AROW Past Earnings
On this page we presented the ANTM earnings surprises information for Anthem, comparing the expected earnings versus the actual earnings quarter by quarter, with the resulting positive or negative percentage surprise. Any self directed investor doing their due diligence on ANTM (or any other given stock) can benefit from researching all of the Anthem past earnings going backwards in time, including how often the company beat or missed the market's expectations. To help you with this Anthem earnings surprise research, on this page we presented each quarter's resulting numbers for easy comparison. Studying these numbers can help an investor by providing important context with which to think about ANTM's next earnings report. In your continued research on Anthem we hope you will be sure to check out the further links included for revenue and earnings history as well as next earnings dates for ANTM. Thanks for visiting, and the next time you need to research ANTM earnings surprises or those of another stock, we hope you'll think of our site as your go-to earnings surprises research resource of choice.

Recommended: HAL Historical Stock Prices, Top Ten Hedge Funds Holding RWJ, OMAB Options Chain.


ANTM Earnings Surprises | www.NextEarningsDate.com | Copyright © 2020 - 2022, All Rights Reserved

Nothing in NextEarningsDate.com is intended to be investment advice, nor does it represent the opinion of, counsel from, or recommendations by BNK Invest Inc. or any of its affiliates, subsidiaries or partners. None of the information contained herein constitutes a recommendation that any particular security, portfolio, transaction, or investment strategy is suitable for any specific person. All viewers agree that under no circumstances will BNK Invest, Inc,. its subsidiaries, partners, officers, employees, affiliates, or agents be held liable for any loss or damage caused by your reliance on information obtained. By visiting, using or viewing this site, you agree to the following Full Disclaimer & Terms of Use and Privacy Policy. Video widget and market videos powered by Market News Video. Quote and option data delayed at least 15 minutes; stock quote data powered by Ticker Technologies, and Mergent.