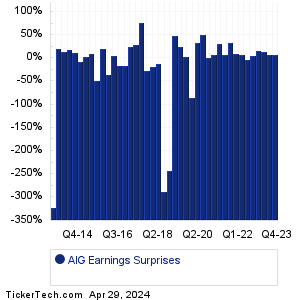
| American Intl Gr Earnings Surprises | ||||||||||||||||||||||||||||||||||||||||||||||||||||||||||||||||||||||||||||||||||||||||||||||||||||||||||||||||||||||||||||||||||||||||||||||||||||||||||||||||
|
|
|
| American Intl Gr Earnings Surprises | ||||||||||||||||||||||||||||||||||||||||||||||||||||||||||||||||||||||||||||||||||||||||||||||||||||||||||||||||||||||||||||||||||||||||||||||||||||||||||||||||
|
|
|
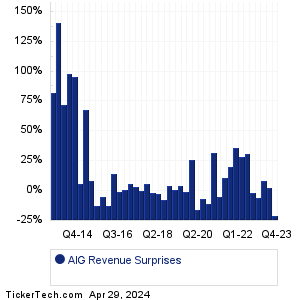
| AIG Revenue Surprises | ||||||||||||||||||||||||||||||||||||||||||||||||||||||||||||||||||||||||||||||||||||||||||||||||||||||||||||||||||||||||||||||||||||||||||||||||||||||||||||||||
|
| AIG Current Stock Quote |
Get Dividend Alerts Get SEC Filing Alerts |
| AIG Stock Price Chart |
| Next Earnings Dates |
Next Earnings Date Calendar:Cigna Group (CI): 8/3/2023 6:00 AMAir Products & Chemicals (APD): 8/3/2023 6:00 AM Ball (BALL): 8/3/2023 6:00 AM Entegris (ENTG): 8/3/2023 6:00 AM Targa Resources (TRGP): 8/3/2023 6:00 AM EPAM Sys (EPAM): 8/3/2023 6:00 AM Cognex (CGNX): 8/3/2023 6:00 AM Lamar Advertising (LAMR): 8/3/2023 6:00 AM WESCO Intl (WCC): 8/3/2023 6:00 AM Tempur Sealy Intl (TPX): 8/3/2023 6:00 AM More from the Next Earnings Dates Calendar Earnings History:Radian Group (RDN): 8/2/2023 5:57 PMEnstar Gr (ESGR): 8/2/2023 5:12 PM United States Lime (USLM): 8/2/2023 5:11 PM Spirit Airlines (SAVE): 8/2/2023 5:07 PM Earthstone Energy (ESTE): 8/2/2023 5:05 PM Sturm Ruger & Co (RGR): 8/2/2023 5:05 PM Envela (ELA): 8/2/2023 5:01 PM Conformis (CFMS): 8/2/2023 5:00 PM Via Renewables (VIA): 8/2/2023 5:00 PM Enviva (EVA): 8/2/2023 5:00 PM More from the Earnings History archive |
| Earnings Peers |
| American Intl Gr (AIG) is categorized under the Financials sector; to help you further research past earnings across stocks, below are some other companies in the same sector:
AIRC Historical Earnings AIV Historical Earnings AIZ Historical Earnings AJG Historical Earnings AJX Historical Earnings AKR Historical Earnings ALBT Historical Earnings ALEX Historical Earnings ALL Historical Earnings ALLY Historical Earnings |
Click the button below for your complimentary copy of Your Early Retirement Portfolio: Dividends Up to 7.8%—Every Month—Forever.
You'll discover the details on 4 stocks and funds that pay you massive dividends as high as 7.8%.