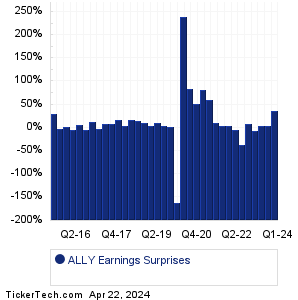
| Ally Financial Earnings Surprises | ||||||||||||||||||||||||||||||||||||||||||||||||||||||||||||||||||||||||||||||||||||||||||||||||||||||||||||||||||||||||||||
|
|
|
| Ally Financial Earnings Surprises | ||||||||||||||||||||||||||||||||||||||||||||||||||||||||||||||||||||||||||||||||||||||||||||||||||||||||||||||||||||||||||||
|
|
|
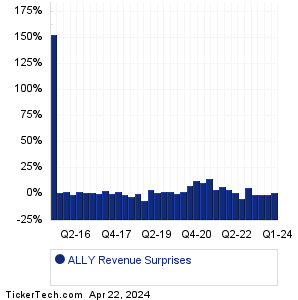
| ALLY Revenue Surprises | ||||||||||||||||||||||||||||||||||||||||||||||||||||||||||||||||||||||||||||||||||||||||||||||||||||||||||||||||||||||||||||
|
| ALLY Current Stock Quote |
Get Dividend Alerts Get SEC Filing Alerts |
| ALLY Stock Price Chart |
| Next Earnings Dates |
Next Earnings Date Calendar:Truist Financial (TFC): 1/19/2023 5:45 AMComerica (CMA): 1/19/2023 6:00 AM Commerce Bancshares (CBSH): 1/19/2023 6:00 AM Banc of California (BANC): 1/19/2023 6:00 AM Fifth Third Bancorp (FITB): 1/19/2023 6:30 AM KeyCorp (KEY): 1/19/2023 6:30 AM Insteel Indus (IIIN): 1/19/2023 6:30 AM M&T Bank (MTB): 1/19/2023 6:40 AM BankUnited (BKU): 1/19/2023 6:45 AM Procter & Gamble (PG): 1/19/2023 7:00 AM More from the Next Earnings Dates Calendar Earnings History:William Penn (WMPN): 1/18/2023 5:00 PMWintrust Financial (WTFC): 1/18/2023 After close Synovus Financial (SNV): 1/18/2023 After close Discover Financial (DFS): 1/18/2023 After close First Bancorp (FNLC): 1/18/2023 After close Eagle Bancorp (EGBN): 1/18/2023 After close Amcon Distributing (DIT): 1/18/2023 After close Alcoa (AA): 1/18/2023 After close Limestone Bancorp (LMST): 1/18/2023 After close Texas Capital Bancshares (TCBI): 1/18/2023 After close More from the Earnings History archive |
| Earnings Peers |
| Ally Financial (ALLY) is categorized under the Financials sector; to help you further research past earnings across stocks, below are some other companies in the same sector:
ALRS Historical Earnings ALTA Historical Earnings ALX Historical Earnings AMAL Historical Earnings AMBC Historical Earnings AMG Historical Earnings AMH Historical Earnings AMK Historical Earnings AMNB Historical Earnings AMP Historical Earnings |