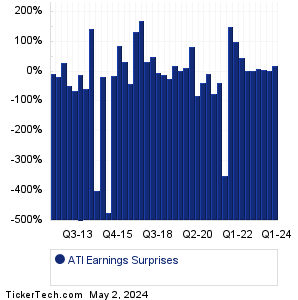
| ATI Earnings Surprises | ||||||||||||||||||||||||||||||||||||||||||||||||||||||||||||||||||||||||||||||||||||||||||||||||||||||||||||||||||||||||||||||||||||||||||||||||||||||||||||||||
|
|
|
| ATI Earnings Surprises | ||||||||||||||||||||||||||||||||||||||||||||||||||||||||||||||||||||||||||||||||||||||||||||||||||||||||||||||||||||||||||||||||||||||||||||||||||||||||||||||||
|
|
|
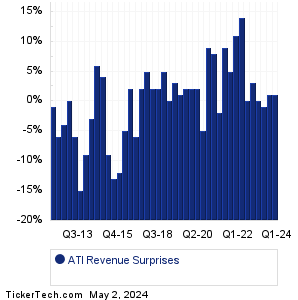
| ATI Revenue Surprises | ||||||||||||||||||||||||||||||||||||||||||||||||||||||||||||||||||||||||||||||||||||||||||||||||||||||||||||||||||||||||||||||||||||||||||||||||||||||||||||||||
|
| ATI Current Stock Quote |
Get Dividend Alerts Get SEC Filing Alerts |
| ATI Stock Price Chart |
| Next Earnings Dates |
Next Earnings Date Calendar:Emerald Holding (EEX): 11/6/2023 6:25 AMFreshpet (FRPT): 11/6/2023 6:30 AM Graham (GHM): 11/6/2023 6:30 AM Constellation Energy (CEG): 11/6/2023 6:49 AM Treehouse Foods (THS): 11/6/2023 6:55 AM Janus Intl Gr (JBI): 11/6/2023 6:55 AM Affiliated Managers Group (AMG): 11/6/2023 7:00 AM Krystal Biotech (KRYS): 11/6/2023 7:00 AM Axsome Therapeutics (AXSM): 11/6/2023 7:00 AM Stran & Co (SWAG): 11/6/2023 7:00 AM More from the Next Earnings Dates Calendar Earnings History:Berkshire Hathaway Inc. Common Stock (BRK-A): 11/4/2023 7:00 AMBerkshire Hathaway Inc. New Common Stock (BRK-B): 11/4/2023 7:00 AM PhenomeX (CELL): 11/3/2023 5:20 PM Cue Biopharma (CUE): 11/3/2023 After close Eversource Energy (ES): 11/3/2023 After close Biglari Holdings (BH): 11/3/2023 After close Prime Medicine (PRME): 11/3/2023 After close Kineta (KA): 11/3/2023 After close The York Water (YORW): 11/3/2023 10:14 AM Liberty Braves Group (BATRA): 11/3/2023 8:15 AM More from the Earnings History archive |
| Earnings Peers |
| ATI (ATI) is categorized under the Materials sector; to help you further research past earnings across stocks, below are some other companies in the same sector:
ATR Historical Earnings AUVI Historical Earnings AVD Historical Earnings AVNT Historical Earnings AVTR Historical Earnings AVY Historical Earnings AWI Historical Earnings AZEK Historical Earnings AZZ Historical Earnings BALL Historical Earnings |
Recommended: GPI shares outstanding history, Funds Holding SGOL, Funds Holding JFC.
Click the button below for your complimentary copy of Your Early Retirement Portfolio: Dividends Up to 8.1%—Every Month—Forever.
You'll discover the details on 4 stocks and funds that pay you massive dividends as high as 8.1%.